
|
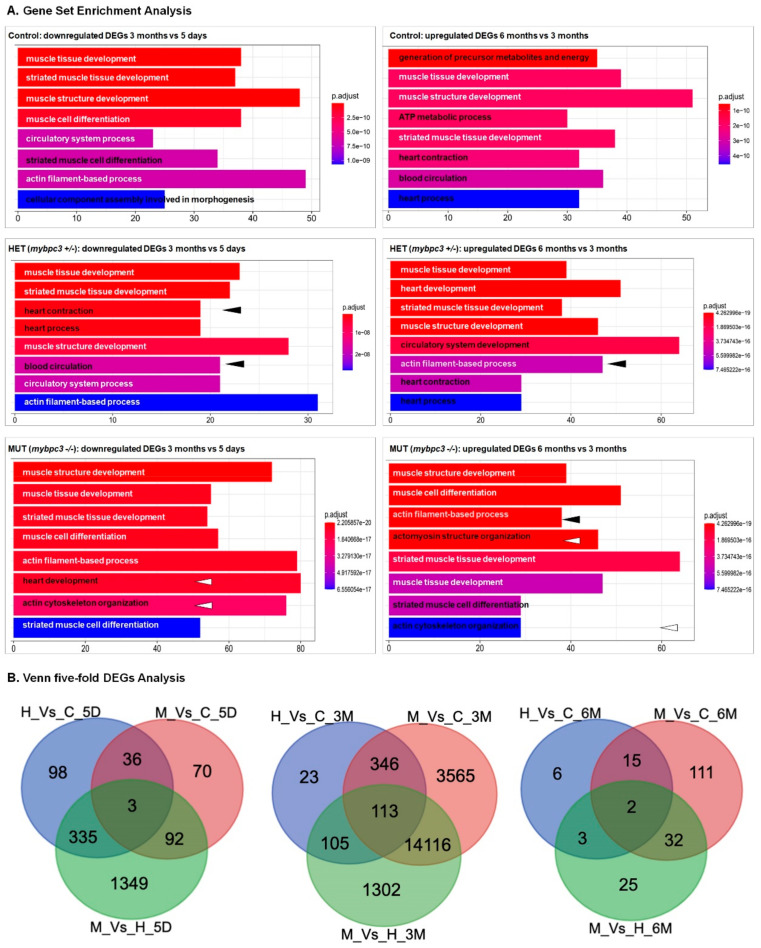
Fig. 8
A Venn diagram illustrating the differentially expressed genes (DEGs). (A) DEGs were examined for the groups across heart development (time: 5 days, 3 months, and 6 months). (B) DEGs whose expression was changed ?1-fold throughout normal physiologic growth (control (wild-type), red circle), or hypertrophic growth (mypbc3+/?, blue circle; mypbc3?/?, green circle). Subsections of the Venn diagram include genes that are exclusively regulated during physiologic growth, regulated during both physiologic and hypertrophic growth, and regulated exclusively during hypertrophic growth. The values listed indicate the number of genes that belong to each section. The genes that comprise each subsection of the Venn diagram are available in Supplementary Table S1 (cardiac physiologic growth), and Supplementary Table S2 (cardiac hypertrophic growth).