
|
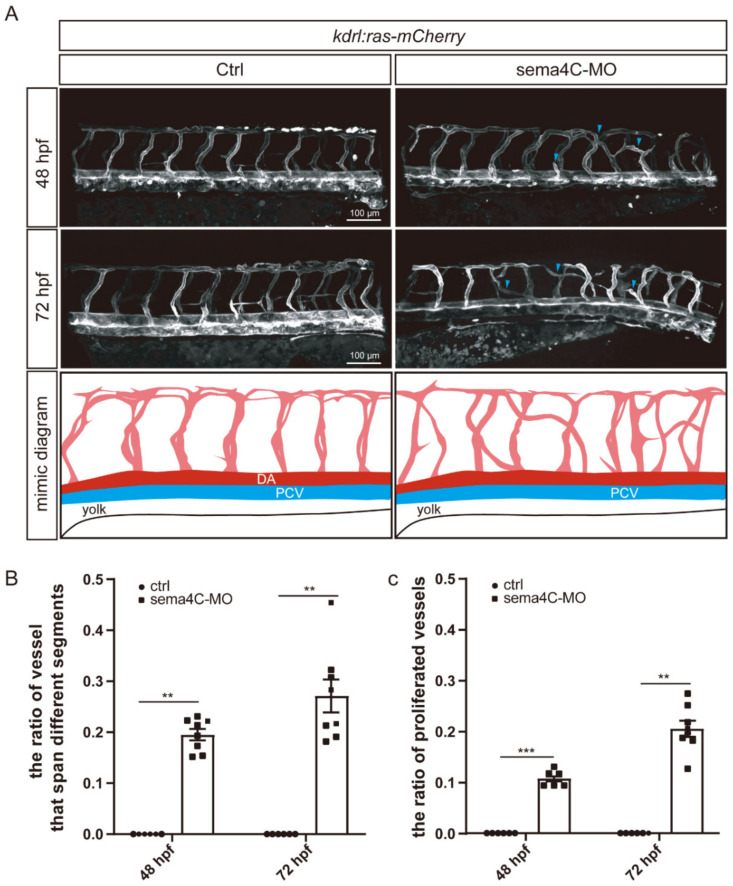
Fig. 4
Deficiency of sema4C leads to abnormal vascular networks. (A). Confocal imaging and the schematic diagram of ISVs in the control and sema4C-MO Tg(kdrl:ras-mCherry) zebrafish at different stages. As shown in the diagram, ISVs in the control group were orderly arranged and grew upwards, while ISVs? growth turned to horizontal germination and connected to adjacent ISVs, or even the opposite ISVs. In sema4C knockdown of zebrafish, blue arrowheads indicate aberrant ISVs; (B). The statistical analysis of the ratio of vessels that crossed different segments in the control and sema4C morphants at different stages?Mann?Whitney test, 48 hpf: ** p = 0.0012; 72 hpf: ** p = 0.0012; (C). The statistical analysis of proliferated vessel ratio in the control and sema4C morphants at different stages?Mann?Whitney test, 48 hpf: *** p = 0.0006; 72 hpf: ** p = 0.0012.