
Image
|
Figure Caption
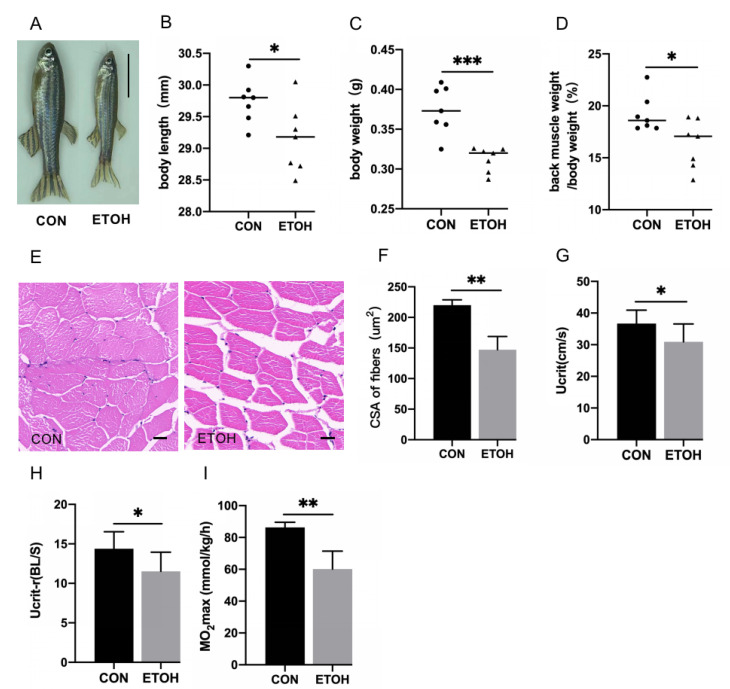
Fig. 1
Morphology, skeletal muscle histology, and exercise capacity analysis of alcohol-induced zebrafish. (A) Comparison of appearance. Bar = 10 mm. (B) Body length (mm). (C) Body weight (g). (D) Back muscle proportion of body weight (%). (E) Hematoxylin?eosin (HE) staining. Bar = 20 �m. (F) Cross-sectional area (CSA) of muscle fibers (?m2). (G) Absolute critical swimming speed (cm/s). (H) Relative critical swimming speed (body length/second). (I) Maximal oxygen uptake (mmol/kg/h). n = 7. * p < 0.05, ** p < 0.01, *** p < 0.001.
Figure Data
Acknowledgments
This image is the copyrighted work of the attributed author or publisher, and
ZFIN has permission only to display this image to its users.
Additional permissions should be obtained from the applicable author or publisher of the image.
Full text @ Life (Basel)