
|
Fig. 6
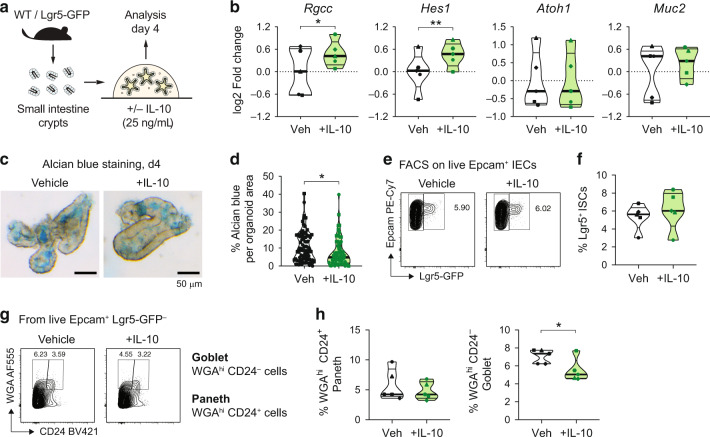
a Schematics for mouse SI organoid cultures. Organoids were grown in ENR media (containing EGF, Noggin, and R-Spondin) supplemented with recombinant murine IL-10 or BSA (Vehicle control). b RNA expression analysis by qRT-PCR from organoids treated with IL-10. Each dot represents SI organoids generated from an individual mouse (N?=?5 independent mice). c Alcian blue staining of SI organoids in vehicle- and IL-10-treated organoids. Scale bar?=?50?�m. d Percentage of the ab-stained area from the total organoid area. Dots represent single organoids imaged from 2 independent experiments/mice. e Flow cytometry analysis of organoids generated from SI crypts of Lgr5-GFP mice. Representative contour plots showing the percentage of intestinal stem cells (Epcam+ Lgr5-GFP+ cells) are shown. f Frequency of Lgr5+ intestinal stem cells (ISCs) after IL-10 treatments. Dots represent pools of organoids collected from 5 different mice. g Representative contour plots of WGA/CD24 stainings on disaggregated organoids treated with IL-10. h Frequencies of goblet cells (Epcam+ Lgr5-GFP- WGAhi CD24-) and paneth cells (Epcam+ Lgr5- WGAhi CD24+) from vehicle and IL-10-treated SI organoids. N?=?5 independent mice. Independent experiments are represented by different symbol shapes in b, d, f and h. Conventional two-tailed t-test was performed in d, whereas paired two-tailed t tests were performed in b, f and h (*p?<?0.05, **p?<?0.01).