
Fig. 2
|
Fig. 2
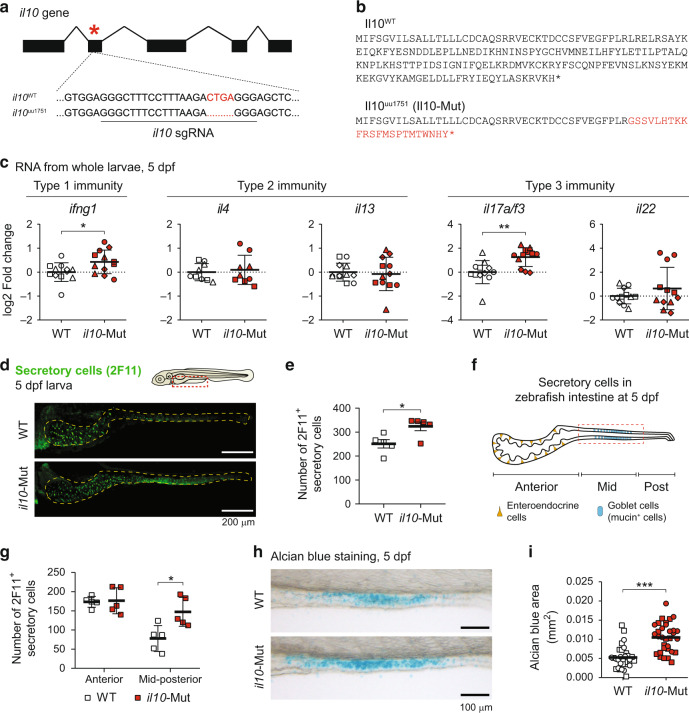
a Schematic for the mutation generated in the zebrafish il10 gene (il10uu1751, -4bp) by CRISPR/Cas9. b Predicted protein sequences for Il10 in WT and il10-Mut individuals, according to the DNA sequences obtained. c Whole-body expression levels of type 1, type 2, and type 3 cytokines in WT (white symbols) and il10-Mut larvae (red symbols) by qRT-PCR. Each dot represents a pool of 5?10 larvae collected in 3?4 independent experiments. d Whole-mount immunofluorescence staining in 5dpf WT and il10-Mut larvae using the pan-secretory marker antibody 2F11. Scale bar?=?100?�m. e Quantification of 2F11+ cells in the intestines of WT and il10-Mut larvae. Each dot represents individual larvae collected in 2 independent experiments. f Diagram for the larval zebrafish intestinal tract showing the location of Goblet cells in the mid-intestinal region. g Stratification of the number of 2F11+ cells in the anterior or mid-posterior intestines of WT and il10-Mut larvae (N?=?5). h Alcian blue (ab) staining on 5dpf WT and il10-Mut larvae. i Automatic quantifications of the ab-stained area in the mid intestines of WT and il10-Mut larvae. Each dot corresponds to an individual larva collected in two independent experiments. Different symbol shapes represent independent experiments in c and i. Two-tailed student t tests were used for the comparisons in c, e, g and i. (*p?<?0.05; **p?<?0.01; ***p?<?0.001).