
|
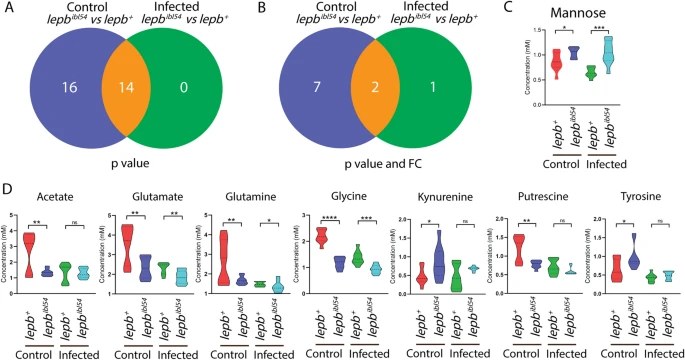
Fig. 3
Venn diagrams show the number of metabolites from pooled zebrafish larvae measured by HR-MAS NMR spectroscopy between the lepbibl54 and lepb+ in the uninfected control and infected conditions. A A Venn diagram shows the number of metabolites between the lepbibl54 and lepb+ zebrafish larvae in the uninfected control and infected conditions with p?<?0.05. B A Venn diagram shows the number of metabolites between the lepbibl54 and lepb+ zebrafish larvae in the uninfected control and infected conditions with p?<?0.05 and FC?>?1.5 or FC?<????1.5. FC fold change. C Quantification of the one metabolite mannose in B. *p?<?0.05, ***p?<?0.001. D Quantification of the seven metabolites in B. **p?<?0.01, ****p?<?0.0001. ns non-significant