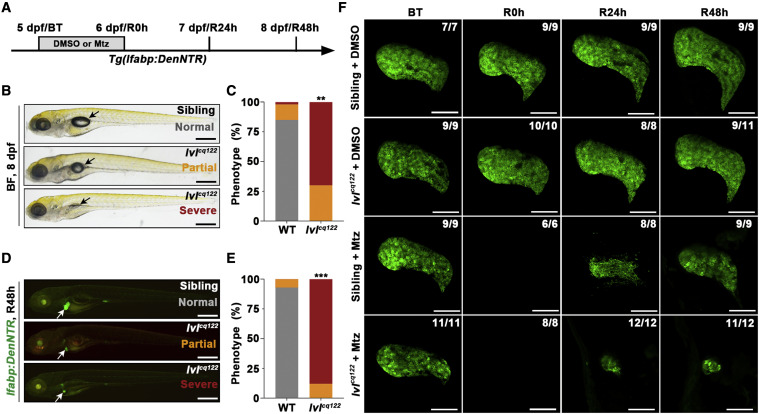
Fig. 1 Figure 1. Liver regeneration is impaired in the lvl mutant (A) Experimental schematic illustrating the stages of Mtz treatment and analysis at BT, R0h, R24h, and R48h. (B) Bright-field (BF) images showing the body phenotype of sibling and lvl larvae at R48h. The lvl mutant embryos exhibit partial or severe deficiency of the swim bladder (arrows). (C) Quantification of the phenotypic proportion of the swim bladder in sibling and lvl in (B); n = 50 larvae. ??p < 0.01 by t test. (D) Epifluorescence images showing lfabp:DenNTR expression (green) of sibling and lvl mutant treated with Mtz at R48h. Arrows point to the liver. (E) Quantification of the phenotypic proportion of lfabp:DenNTR expression at R48h in (D); n = 50 larvae. ???p < 0.001 by t test. (F) Confocal projection images showing liver development and regenerating livers after Mtz treatment in sibling and lvl mutant from BT to R48h. Numbers indicate the proportion of larvae exhibiting the phenotype shown. Scale bars, 100 ?m (F) and 400 ?m (B and D). BT, before Mtz treatment. See also Figure S1.
Image
Figure Caption
Figure Data
Acknowledgments
This image is the copyrighted work of the attributed author or publisher, and
ZFIN has permission only to display this image to its users.
Additional permissions should be obtained from the applicable author or publisher of the image.
Full text @ Cell Rep.

