
|
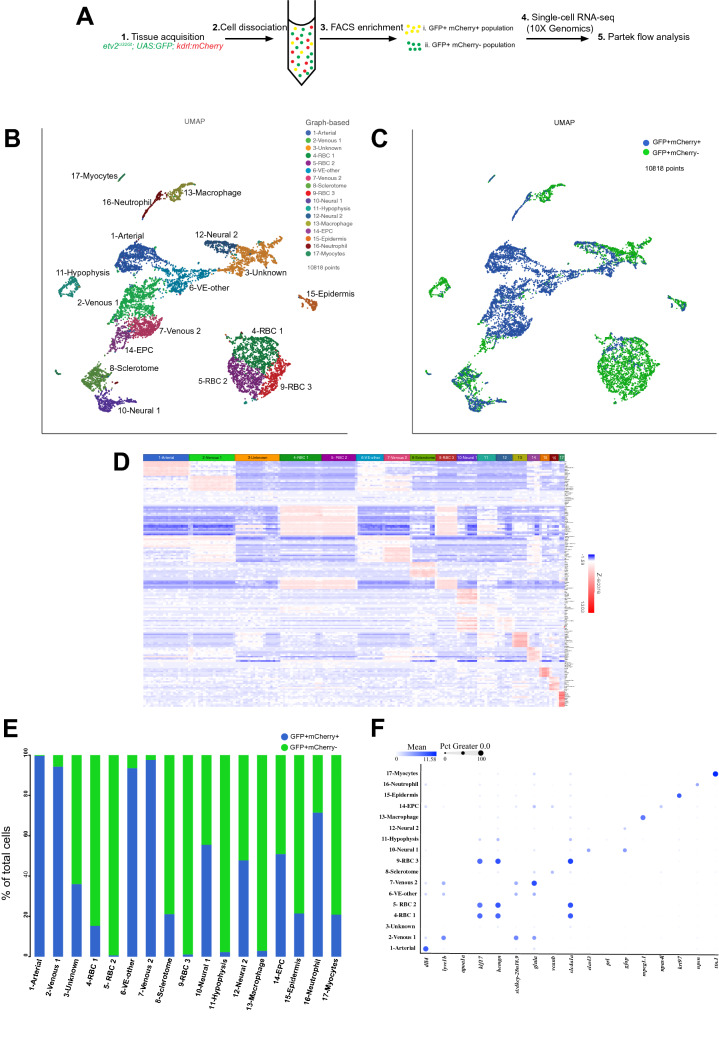
Fig. 1
The scRNA-seq analysis of etv2ci32Gt; UAS:GFP; kdrl:mCherry embryos at the 24 hpf stage. (A) Schematics of the experimental design for scRNA-seq. (B) UMAP plot of 10,818 cells with 17 distinct clusters. Classifications were based on previously known marker genes which were significantly enriched in each cluster. RBC, red blood cells; VE, vascular endothelial; EPC, endothelial progenitor cells. (C) UMAP plot showing the distribution of GFP?+?mCherry?+?and GFP?+?mCherry- cells. (D) A heatmap showing expression of top marker genes in different clusters. Enlarged heatmap and gene list is shown in Fig. S1. (E) Fraction of GFP?+?mCherry?+?and GFP?+?mCherry- cells within each cluster. (F) A dot plot showing the expression of selected marker genes in different clusters.