
|
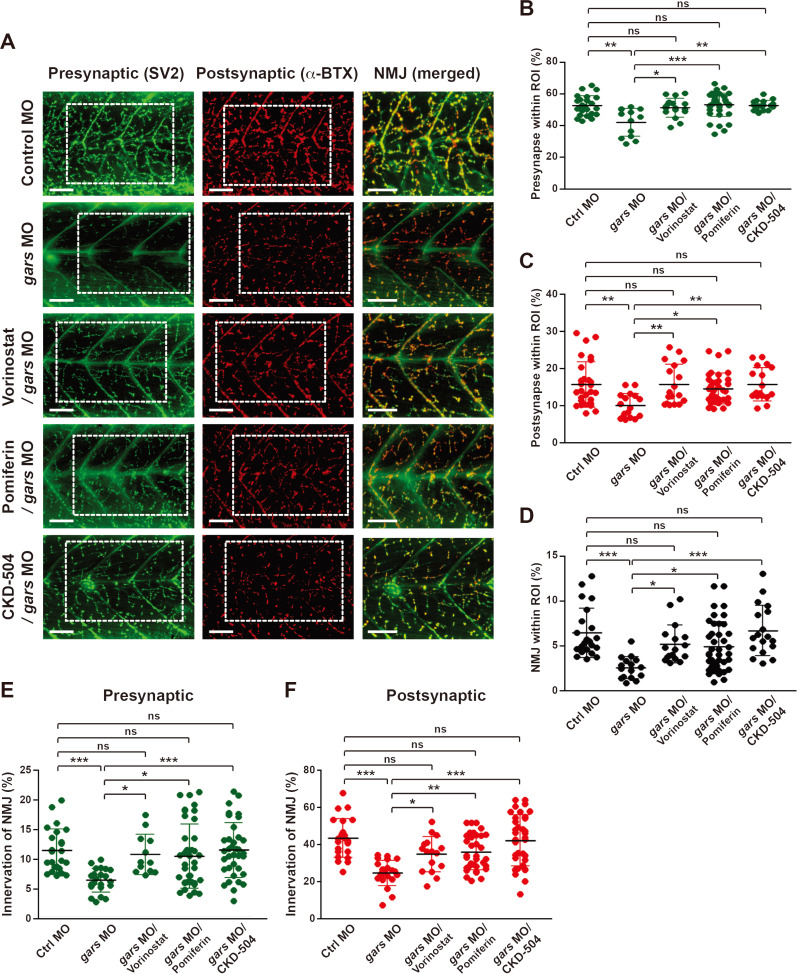
Fig. 6
(A) Lateral view images after staining with anti-SV2 and α-BTX of a whole-mounted zebrafish injected with control or gars MOs, or treated with CKD-504 or FDA-approved drugs. The merged images are magnified from the images in the rectangular regions. Scale bars = 50 μm. (B-D) Comparisons of presynapse (B), postsynapse (C), and NMJ (D) signal ratios within the ROI among zebrafish embryos injected with control MOs (n = 29), gars MOs (n = 17), gars MOs with vorinostat (n = 18), pomiferin (n = 41), or CKD-504 (n = 18). Statistical significance was assessed using one-way ANOVA followed by Tukey’s post hoc test. *P < 0.05; **P < 0.01; ***P < 0.001. ns, non-significant. (E and F) Comparison of NMJ innervation in the presynaptic area (E) and postsynaptic (F) areas among zebrafish embryos injected with control MOs (n = 24); gars MOs (n = 22); and gars MOs with vorinostat (n = 16), pomiferin (n = 36), and CKD-504 (n = 36). Statistical significance was determined using one-way ANOVA followed by Tukey’s post hoc test. *P < 0.05; **P < 0.01; ***P < 0.001. ns, non-significant.