
|
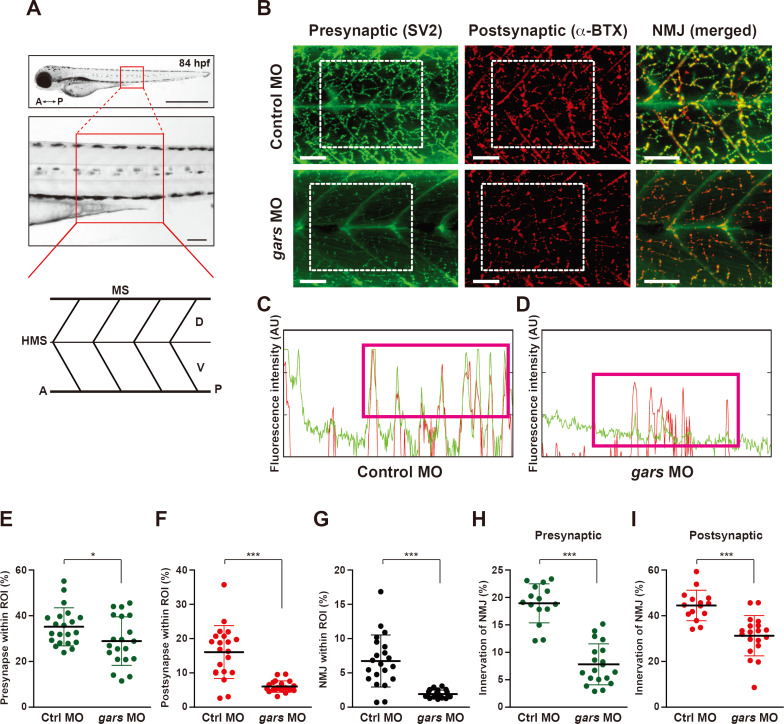
Fig. 2
(A) Schematic showing the representative region where NMJs in the larval trunks were analyzed and observed. A, anterior; P, posterior; HMS, horizontal myoseptum; MS, myosepta; D, dorsal; V, ventral. Scale bars = 1,000 μm (top images) and 50 μm (bottom images). (B) Lateral view images after staining with anti-SV2 (presynaptic region) and α-BTX (postsynaptic region) of the whole-mounted larva injected with control or gars MOs at 84 hpf. Merged images (NMJ) are magnified from the images in the rectangular regions. Scale bars = 50 μm. (C and D) Comparison of fluorescence intensity (a.u.) (green, presynapse; red, postsynapse) between control MOs- (C) and gars MOs-injected (D) zebrafish embryos. (E-G) Comparisons of presynapse (E), postsynapse (F), and NMJ (G) signal ratios within the region of interest (ROI) between control MOs- (n = 21) and gars MOs-injected (n = 20) zebrafish embryos. Statistical significance was determined using unpaired Student’s t-test. *P < 0.05; ***P < 0.001. (H and I) Comparisons of NMJ innervation in the presynaptic area (H) and postsynaptic (I) areas between control MOs- (n = 15) and gars MOs-injected (n = 19) zebrafish embryos. Statistical significance was determined using unpaired Student’s t-test. ***P < 0.001.