
|
Fig. 1
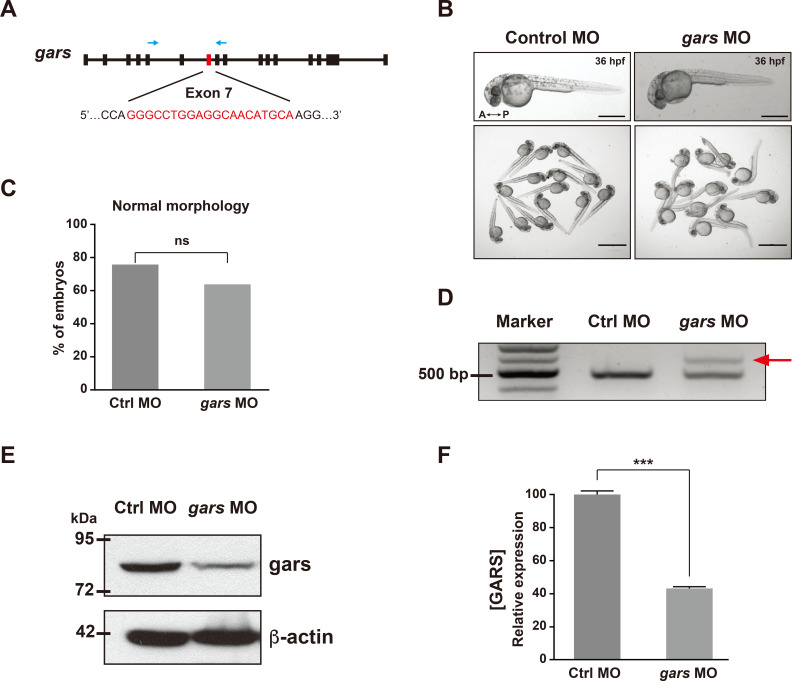
(A) Schematic of the target of the designed splicing-blocking morpholino oligos (MOs) on exon 7, targeting the zebrafish gars gene (red letters). Blue arrows indicate the targets of the primers used for RT-PCR showin in (D). (B) Images showing morphologies of control MOs- or gars MOs-injected larvae at 36 hpf. A, anterior; P, posterior. Scale bars = 500 μm (individual images); 2,000 μm (group images). (C) Quantification of zebrafish embryos showing morphological phenotypes, counted in each genotype at 5 dpf. Statistical significance was determined using unpaired Student’s t-test. ns, non-significant. (D) RT-PCR results confirming gars splicing on exon 7. A red arrow indicates an alternative splicing form induced by gars MOs. (E and F) Comparison of zebrafish gars expression between control and gars KD zebrafish. Results of immunoblot assays for gars and β-actin (E). Protein levels were normalized against β-actin in the same blots, and the quantification of gars expression is presented graphically in (F). Statistical significance was determined using unpaired Student’s t-test. ***P < 0.001.