
Image
|
Figure Caption
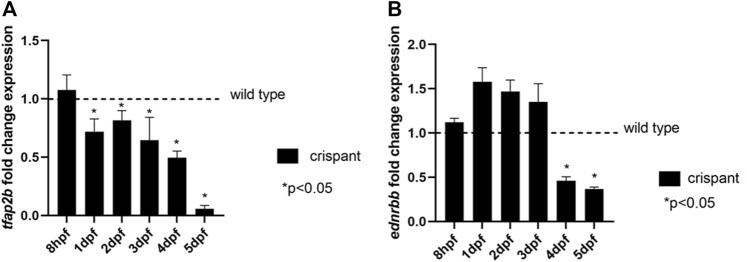
Fig. 4
Expression levels of tfap2b and ednrbb during zebrafish development. (A) Expression levels of tfap2b in crispant fish at 8 hpf, 1, 2, 3, 4, and 5 dpf show a significant decrease when compared to wild type, starting from 1 dpf onwards (p < 0.05, unpaired t-test). (B) Expression levels of ednrbb in tfap2b crispants show a significant decrease when compared to wild type fish, at 4 and 5 dpf (p < 0.05, unpaired t-test).
Figure Data
Acknowledgments
This image is the copyrighted work of the attributed author or publisher, and
ZFIN has permission only to display this image to its users.
Additional permissions should be obtained from the applicable author or publisher of the image.
Full text @ Front Cell Dev Biol