Fig. 8
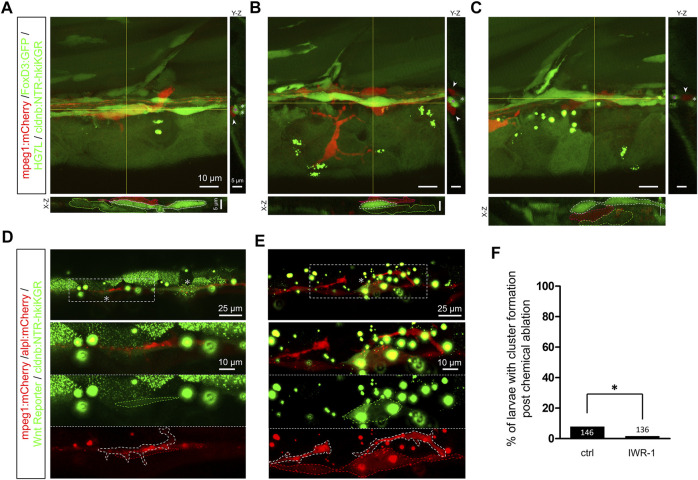
Infiltrated macrophages are found between Schwann cells and interneuromast cells with higher Wnt activity in Mtz-treated larvae. (A?C) Images shown are representative confocal stacked images of Mtz-treated larvae from the cross of Tg(mpeg1:mCherry;FoxD3:GFP) and Tg[?8.0cldnb:NTR-hKikGR;Et(HG7L)] in orthogonal views, while the X-Z and Y-Z views at the position of yellow lines are shown below and on the right side, respectively. Macrophages (red) indicated by red dashed outlines were mostly crawling on interneuromast cells (INCs, brighter green, marked by white dashed outlines) in (A?B). In some cases, macrophages were found between INCs and Schwann cells (SWCs, dim green, labeled by green dashed outlines) (C). Scale bars are the same but only provided in (A) for respective images. (D and E) Images presented are representative stacked confocal images of Mtz-treated larvae from the cross of Tg (mpeg1:mCherry;?8.0cldnb:NTR-hKikGR) and Tg(?4.7alpl:mCherry;6XTcf/LefBS-miniP:d2GFP). Areas shown higher Wnt activity are boxed with dash lines and indicated by asterisks. Magnified diagrams for the dashed rectangles are shown in different color channels to reveal INCs (red, top panel), Wnt signal (dim green, dashed region, middle panel), and macrophage (red, dashed region, bottom panel). Interestingly, some macrophages (enclosed with a white dashed line) interacted with these activated INCs. The scale bar goes to 25 ?m or 10 ?m in magnified diagrams. (F) Larvae were treated without (Ctrl) or with IWR-1 to disrupt Wnt activity, and the percentages of larvae with cluster formation were counted as described previously. Data represent mean ± s.e.m. and were analyzed by one-way ANOVA, *p < 0.05.

