
|
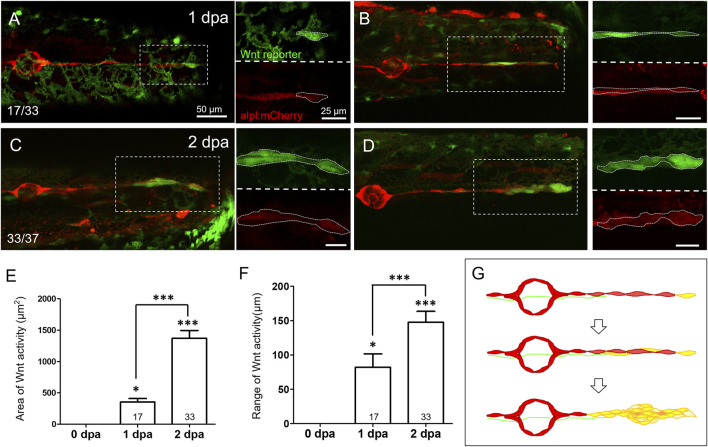
Fig. 4
Wnt activity is enhanced in the lateral line near the injured site at 1?2 days post-injury. Representative superimposed stacked images of two different larvae (A?C) and (B?D) from the cross of Tg(6XTcf/LefBS-miniP:d2GFP) (green) and Tg(?4.7alpl:mCherry) (red) at 1-day post-amputation [dpa, (A?B)] and 2 dpa (C?D) are shown. Magnified diagrams for each dashed rectangle are shown next to the corresponding superimposed photo at the green or red channel. Elevated green Wnt activity outlined by white dashed lines was observed in the surrounding lateral line interneuromast cells near the wound site from 1 dpa. Scales are the same for all superimposed images (A). Scale bars are 25 ?m in magnified images. (E?F) The areas and range of Wnt activity, defined by measuring the extension from tail-cut to the most proximal end, were calculated and shown. Data represent mean � s.e.m. and are analyzed by one-way ANOVA compared to 0 dpa. In addition, the difference between 1 and 2 dpa was analyzed and shown. *p < 0.05, ***p < 0.0005. (G) A series of cartoons illustrates Wnt activity elevation (yellow) during cluster formation.