Fig. 4
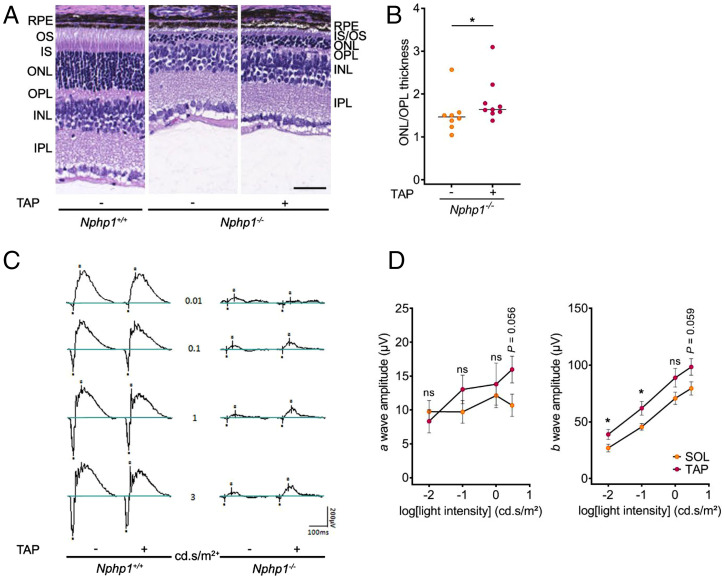
Effect of Taprenepag, an EP2 agonist, on the Nphp1?/?-associated retinopathy. (A) Representative images of H&E staining of retina sections from P21-old Nphp1+/+ and Nphp1?/? mice treated every 3 d with vehicle (5% Solutol) or Taprenepag (18 mg/kg) from P6 to P21. (Scale bar, 50 Ám.) (B) Quantification of ONL/OPL thickness ratio in retinas from P21 Nphp1?/? mice treated with vehicle (n = 8) or Taprenepag (n = 9). Each dot represents one mouse. Bars indicate mean. (C) Scotopic ERG recordings of P21-old Nphp1+/+ or Nphp1?/? retinas upon vehicle or Taprenepag treatment. (D) Quantification of scotopic a- (Left) and b-wave (Right) amplitude versus stimulus intensity (log) in P21 Nphp1?/? mice treated by vehicle (SOL, n = 6) or Taprenepag (n = 7). Mann?Whitney U test: *P < 0.05, ns: not significant. Dots indicate mean ▒ SEM. INL, inner nuclear segment; IPL, inner plexiform layer; IS, inner segment; ONL, outer nuclear segment; OPL, outer plexiform layer; OS, outer segment; RPE, retinal pigmented epithelium; SOL, Solutol; TAP, Taprenepag.

