
|
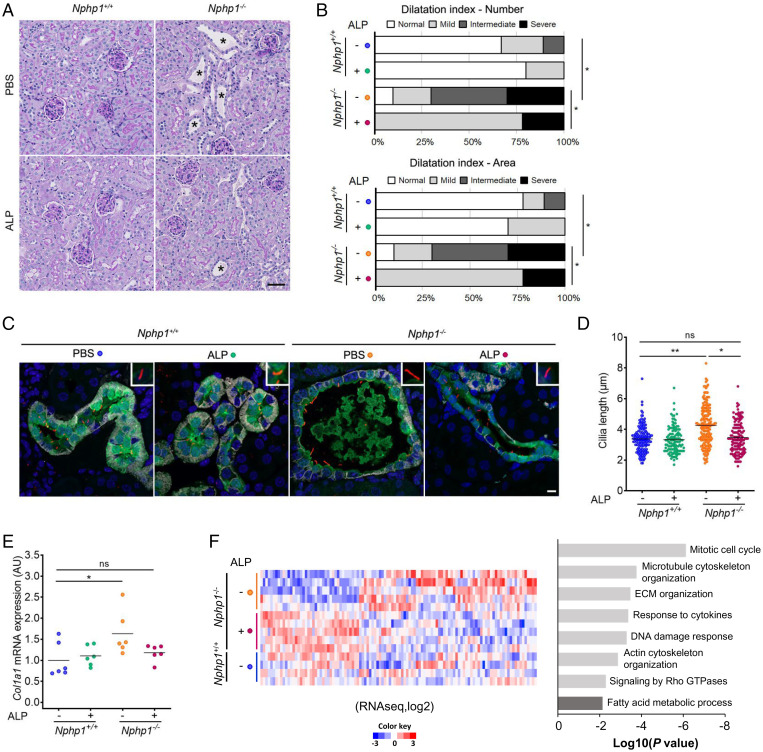
Fig. 3
In vivo validation of the effect of ALP treatment on Nphp1?/? kidney. (A) Representative images of PAS staining of kidney sections from 5-mo-old Nphp1+/+ and Nphp1?/? mice treated daily with vehicle (PBS) or ALP (80 �g/kg) from month 1 to month 5. (Scale bar, 50 �m.) An asterisk signifies tubular dilatations. (B) Dilatation index for 5-mo-old Nphp1+/+ and Nphp1?/? mice upon ALP treatment. (Upper) Dilatation index for the number of dilatation/10 �m2 (cortex). (Lower) Total area covered by dilatations/cortex area. n = 9 to 10 male mice for each genotype/treatment. ?2 test: *P < 0.05. (C) Representative images of immunostaining of 5-mo-old Nphp1+/+ and Nphp1?/? kidney sections upon ALP treatment with anti-Calbindin (CNT, green), anti-ARL13B (cilia, red), anti-Barttin (TAL, DCT, and CNT, gray) antibodies, and DAPI (nuclei, blue). (Scale bar, 5 �m.) (D) Quantification of cilium length in CNT and DCT2 of 5-mo-old Nphp1+/+ and Nphp1?/? mice upon ALP treatment. n = 3 male mice for each genotype/treatment. Each dot represents one cilium. (E) qRT-PCR analysis of Col1a1 expression from 5-mo-old Nphp1+/+ and Nphp1?/? kidneys upon ALP treatment. Each dot represents one individual mouse. For D and E, bars indicate mean. One-way ANOVA followed by Holm?Sidak?s posttest: *P < 0.05, **P < 0.01, ns: not significant. (F) Significantly differentially expressed genes (DEGs) detected by RNA-seq in 5-mo-old Nphp1?/? mice upon ALP treatment. (Left) Heatmap of the 112 genes from the dataset of Nphp1+/+ (n = 4), Nphp1?/? PBS (n = 5), and Nphp1?/? ALP (n = 5) treated mice using signal log-ratio values. Each row represents a gene with up- (red) and down-regulated (blue) expression. (Right) Pertinent down- (light gray) or up-regulated (dark gray) pathways or processes involving these genes highlighted using Metascape. ECM, extracellular matrix; TAL, thick ascending limb of the loop of Henle.