
|
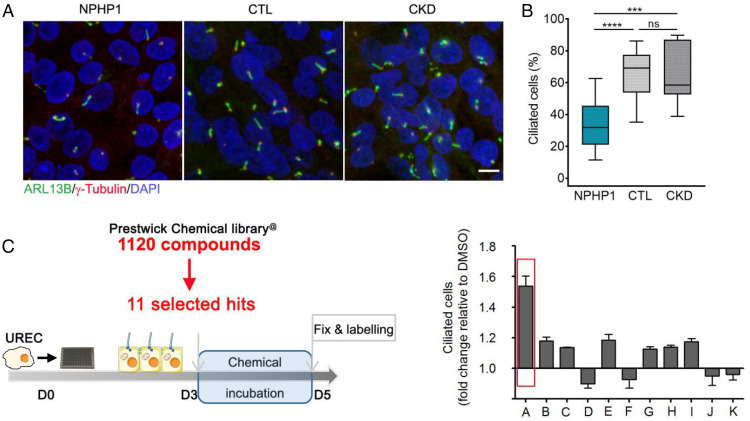
Fig. 1
Drug screen in NPHP1 urine-derived renal epithelial cells (URECs). (A) Representative images of immunofluorescence of primary cilia (ARL13B, green), basal bodies (?-Tubulin, red), and nuclei (DAPI, blue) in URECs derived from NPHP1 patients (NPHP1), control individuals (CTL), and CKD patients 5 d after seeding. (Scale bar, 10 �M.) (B) Quantification of ciliogenesis in NPHP1 (n = 11), CTL (n = 6), and CKD (n = 5) URECs expressed as the mean for all individuals and shown using a box-and-whisker plot. n = 1 to 15 experiments (mean of 3.5 experiments per cell line). Mixed linear-regression model with quasibinomial penalization taking into account the correlation of observations coming from the same individuals using a random effect on the cell line: ***P < 0.001, ****P < 0.0001, ns: not significant. (C, Left) NPHP1 URECs (Pt1) were treated for 2 d with the 11 selected compounds from the primary screen and ciliogenesis was evaluated 5 d after seeding. (Right) Quantification of ciliogenesis. A: ALP, 200 nM; B: Cyproheptadine, 1 �M; C: Ethopropazine, 50 nM; D: Fluticasone, 10 nM; E: Methotrexate, 400 nM; F: Mycophenolic acid, 200 nM; G: Paclitaxel, 100 pM; H: Pyrimethamine, 500 nM; I: Simvastatin, 10 nM; J: Tropisetron, 2 �M; K: Verapamil, 80 nM. Mean � SEM n = 1 to 2 experiments.