
|
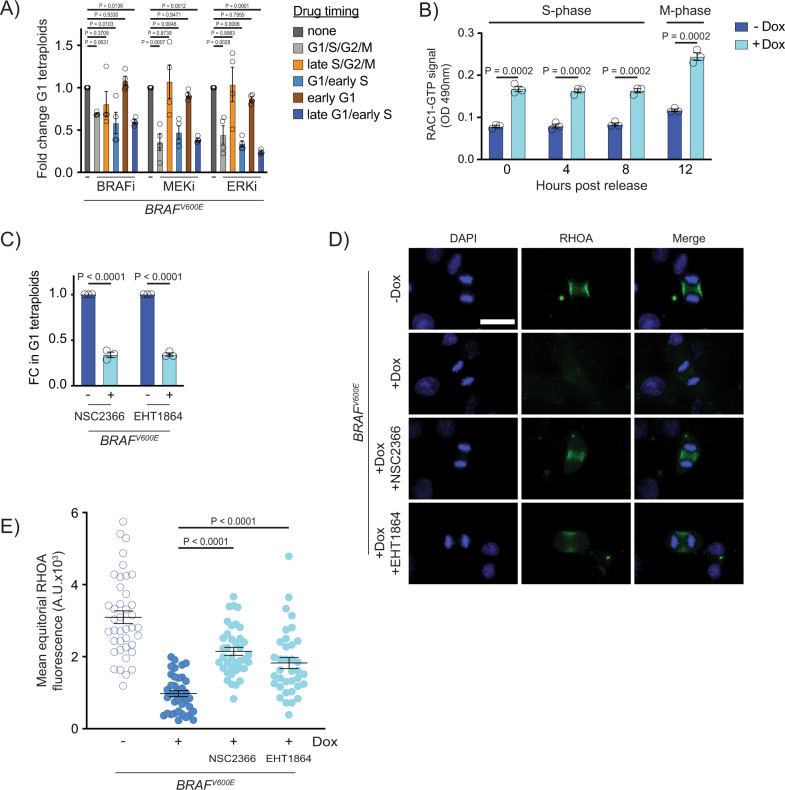
Fig. 4
A Fold change in G1 RPE-1 FUCCI tetraploids following inhibitor treatment. Fold changes are expressed relative to control (+BRAFV600E, no drug) samples. Inhibitors were added at indicated timepoints. N?=?4 independent experiments. One-way ANOVA with Dunnett?s multiple comparisons test. Error bars represent mean?�?SEM. B ELISA-based quantification of RAC1-GTP levels in control (?Dox) and BRAFV600E-expressing (+Dox) RPE-1 cells. Cells were measured at the indicated timepoints post thymidine release. RAC-1 GTP signal was measured using a colorimetric assay at 490?nM absorbance. N?=?3 independent experiments. Unpaired Student?s t test. Error bars represent mean?�?SEM. C Fold change (FC) in G1 RPE-1 FUCCI tetraploids following addition of RAC1 inhibitors. NSC2366 and EHT1864 were added coincident with BRAFV600E induction. Fold changes are expressed relative to control (+BRAFV600E, no drug) cells. N?=?3 independent experiments. Unpaired Student?s t test. Error bars represent mean?�?SEM. D DAPI and anti-RHOA staining in -BRAFV600E (?Dox) cells, BRAFV600E-expressing (+Dox) cells, and BRAFV600E-expressing (+Dox) RPE-1 cells treated with NSC2366 or EHT1864. Drugs were added coincident with Dox administration. Images are maximum intensity projections of z-stacks (0.20?�M). Scale bar = 7.5?�M. E Mean RHOA fluorescence intensity at the equator of control RPE-1 cells, BRAFV600E-expressing RPE-1 cells, and BRAFV600E-expressing RPE-1 cells treated with NSC2366 or EHT1864. Fluorescence intensities (mean gray values) of the equator were measured by sum intensity projections of z-stacks. N?=?40 cells for ?Dox, N?=?38 for +Dox, N?=?38 for +Dox +NSC2366, and N?=?36 for +Dox +EHT1864. Brown-Forsythe and Welch one-way ANOVA with Dunnett?s multiple comparisons test. Error bars represent mean?�?SEM.