
|
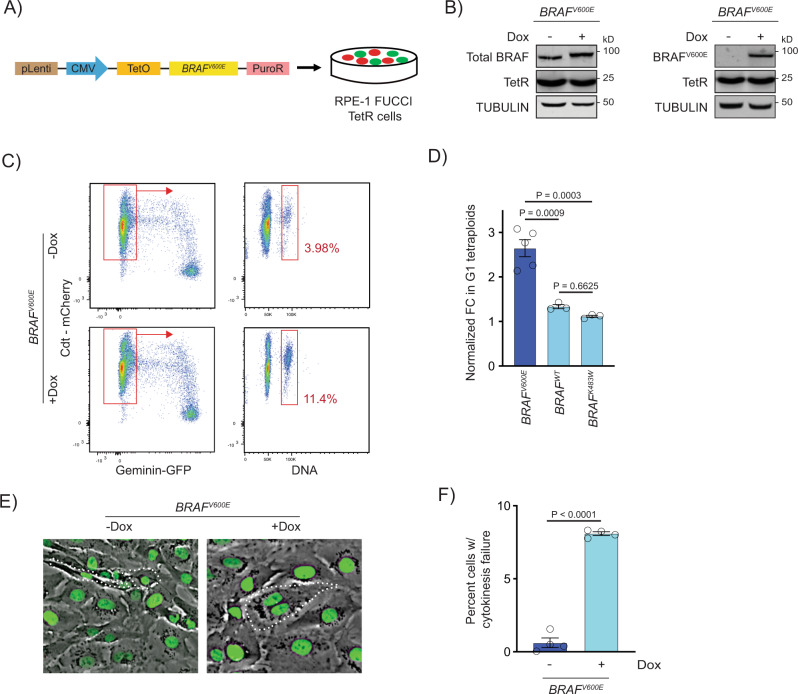
Fig. 2
A Generation of BRAFV600E-expressing RPE-1 FUCCI cell lines with a lentiviral-based doxycycline-inducible vector. B Western blot showing inducible expression of BRAFV600E (+Dox) in RPE-1 FUCCI cells using a BRAF and BRAFV600E-specific antibody. Expression of the Tet repressor protein is shown. TUBULIN was used as the loading control. A representative of three independent biological replicates is shown. C Flow cytometry plots of control (?Dox) and BRAFV600E-expressing (+Dox) RPE-1 FUCCI cells. Tetraploid cells accumulating in G1 were quantified based on Cdt1-mCherry positivity and Hoechst incorporation. Percentages of G1 tetraploid cells in control and BRAFV600E-expressing cultures are indicated. D Fold change (FC) in G1 tetraploids normalized to the control (?Dox) are shown for BRAFV600E, BRAFWT and BRAFK483W (kinase-dead) -expressing RPE-1 FUCCI cell lines. N?=?5 independent experiments for BRAFV600E, N?=?3 for BRAFWT and N?=?3 for BRAFK483W. One-way ANOVA with Tukey?s multiple comparisons test. Error bars represent mean?�?SEM. E Merged phase contrast and GFP photomicrographs of H2B-GFP expressing control (?Dox) and BRAFV600E-expressing (+Dox) RPE-1 cells that have recently undergone mitosis. White dotted lines indicate 2 cells with 1 nucleus each that have separated following a successful cytokinesis (?Dox) and 1 cell with 2 nuclei that has failed cytokinesis (+Dox). F Percentages of cells exhibiting cytokinesis failure in H2B-GFP RPE-1 control (?Dox) and BRAFV600E-expressing (+Dox) cells. N?=?4 independent experiments examining -Dox = 934 and +Dox = 568 cells. Unpaired Student?s t test. Error bars represent mean?�?SEM.