
|
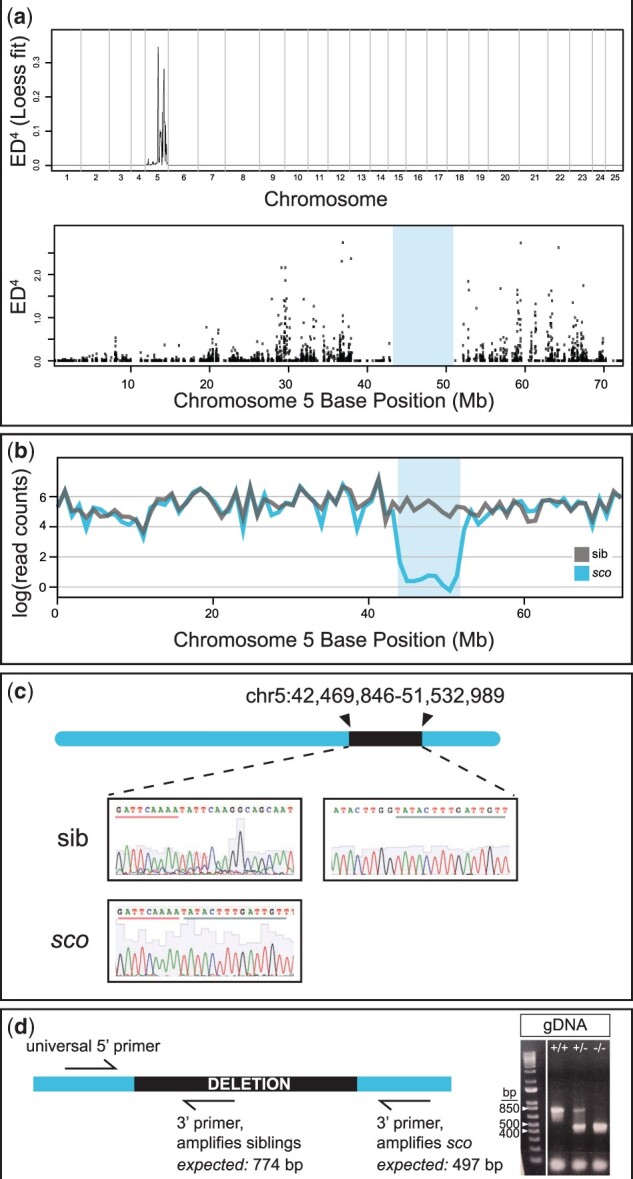
Fig. 6.
Shutdown corner harbors a large deletion on chromosome 5. a) Top, Genome wide Euclidean distance scores, fit with a local regression (LOESS) curve and raised to the fourth power to decrease noise. Note the large feature on chromosome 5. Bottom, Raw Euclidean distance scores for chromosome 5; note the gap between ?40 and 50 Mb (shaded region). b) Comparison of RNA-sequencing read counts, fit with a local regression, between wild-type sibling (gray) and sco mutants (blue). There is a dramatic decrease in mapped reads in the ?40?50 Mb region. c) Sanger sequencing of a wild-type sibling and sco mutant confirms the shutdown corner breakpoint. d) Schematic of genotyping primers and image of PCR products from genomic DNA (gDNA); using the three primers, the wild-type amplicon is 774 bp and the sco amplicon is 497 bp; heterozygotes have both a wild-type and sco mutant amplicon. Reference band sizes in ladder are annotated. Bp, base pair.