
|
Fig. 3
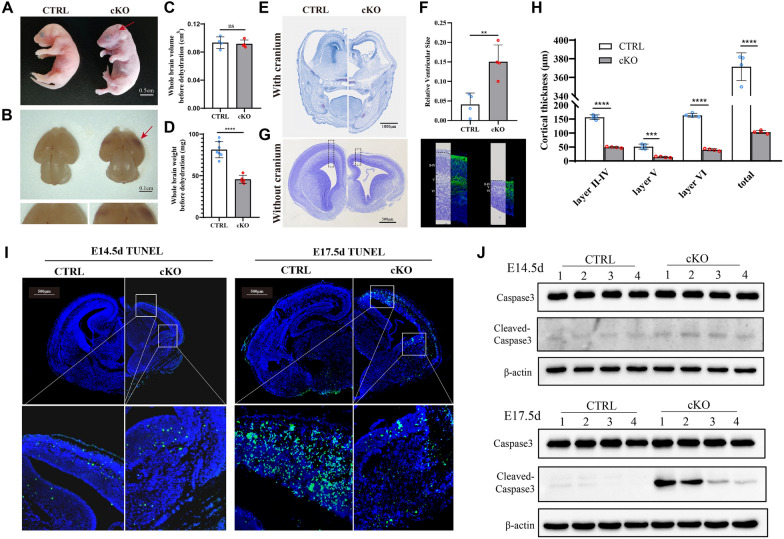
Conditional deletion of Fars2 in mice CNS results in neurodegenerative phenotypes. A The appearance of control (Nes-Cre?; Fars2 fl/fl) and cKO (Nes-Cre+; Fars2 fl/fl) embryos at P 0.5. The purple appearance of the stillbirth cKO embryo is indicated by the arrow. Scale bars: 0.5 cm. B The appearance of the whole brain from control and cKO embryos at E 17.5. The arrow shows red lesions on cerebral cortex of a cKO embryo. Scale bars: 0.1 cm. C The whole brain volume of cKO embryos before dehydration was comparable with control embryos (mean?�?SD; two-tailed unpaired t-Test, ns: non-significant; n?=?4). D The brain weight of cKO embryos before dehydration decreased compared with control embryos (mean?�?SD; two-tailed unpaired t-Test, ****P?<?0.0001; n?=?4). E? F Nissl staining of coronal sections with cranium of control and cKO mice embryo at E 17.5. Scale bars: 1000 ?m. Quantification of ventricle volume showed enlarged volume in cKO embryos compared with control embryos (mean?�?SD; two-tailed unpaired t-Test, **P?<?0.01; n?=?4). G? H Nissl and immunofluorescence staining of coronal sections without cranium of control and cKO mice embryo at E 15.5. Scale bars: 500 ?m. The neurons were stained with TUJ1 to help distinguish cortical layers. The layer thickness of cortical areas in control and cKO embryos was quantified (mean?�?SD; two-tailed unpaired t-Test, ***P?<?0.001; ****P?<?0.0001; n?=?4). ITUNEL staining of brain sections in control and cKO mice at the indicated embryonic ages. Scale bars: 500 ?m. The white frames indicate the dorsal and ventral cortex region with positive signals. J Western blotting for Caspase 3 and Cleaved-caspase 3 in control and cKO mice at the indicated embryonic ages