
Image
|
Figure Caption
Fig. 1
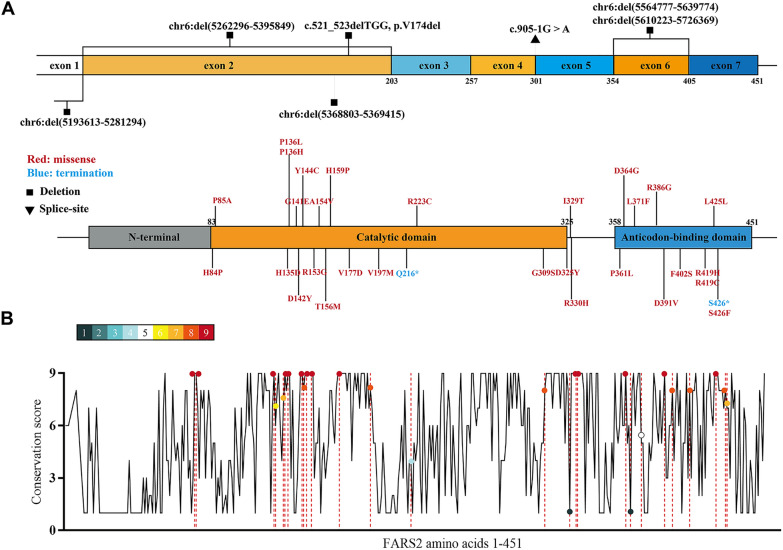
Distribution and conservation analysis of FARS2 pathogenic mutations. A Distribution of 30 missense mutations, 2 nonsense mutations, 6 inframe or outframe deletions and 1 splice-site mutation on human mtPheRS. B A graphical illustration of mtPheRS sequence conservation (black line) based on the ConSurf conservation score. Mutation sites (dots) are indicated
Acknowledgments
This image is the copyrighted work of the attributed author or publisher, and
ZFIN has permission only to display this image to its users.
Additional permissions should be obtained from the applicable author or publisher of the image.
Full text @ Cell Biosci.