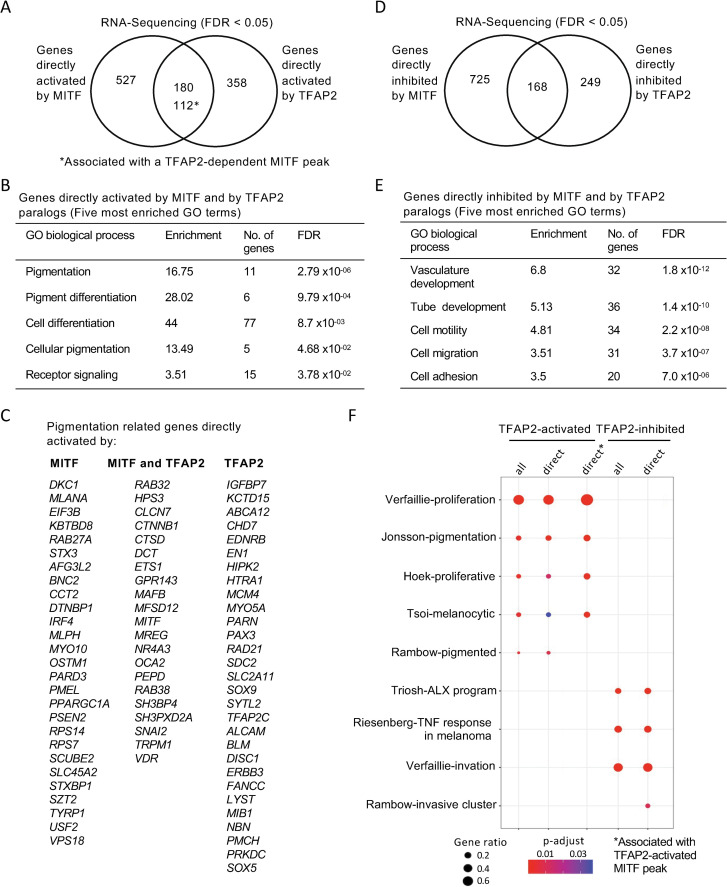
Fig. 5
(A) Venn diagram representing the overlap of genes apparently directly activated by MITF (i.e., expression lower in MITF-KO than in WT cells, FDR < 0.05, and an MITF peak within 100kb of the TSS) and genes directly activated by TFAP2 (i.e., expression lower in TFAP2-KO than in WT cells, FDR < 0.05, and an TFAP2-activated enhancer of any category within 100kb of the TSS). The number of overlapping genes with TFAP2-dependent MITF peaks are also shown (*). (B) Gene ontology (GO) biological process analysis enriched among MITF- and TFAP2-activated genes are shown (Top 5 hits). (C) A curated list of pigment-associated genes [118] was intersected with directly MITF-activated genes, overlapping genes of directly MITF- and TFAP2-activated genes, and directly TFAP2-acitvated genes and represented by gene list. (D) Venn diagram representing directly MITF inhibited genes (MITF peak within 100kb of a TSS), based on RNA-seq, in MITF-KO versus WT cells (FDR < 0.05) and directly TFAP2 inhibited genes (TFAP2-inhibited enhancers, of any category, within 100kb of a TSS), based on RNA-seq, in TFAP2-KO versus WT cells (FDR < 0.05). (E) Gene ontology (GO) biological process analysis enriched among MITF- and TFAP2-inhibited genes are shown (Top 5 most enriched GO terms). GO analysis was performed using PANTHER. (F) Dot plot of enrichment analysis showing the enrichment of melanoma gene signatures from the literature in directly TFAP2-activated and TFAP2-inhibted genes. P value is red lowest to blue highest; gene ratio is the fraction of all genes in the gene signature category that are included in the set identified here. TFAP2-activated genes associated with TFAP2-dependent MITF peaks are shown (*).

