
|
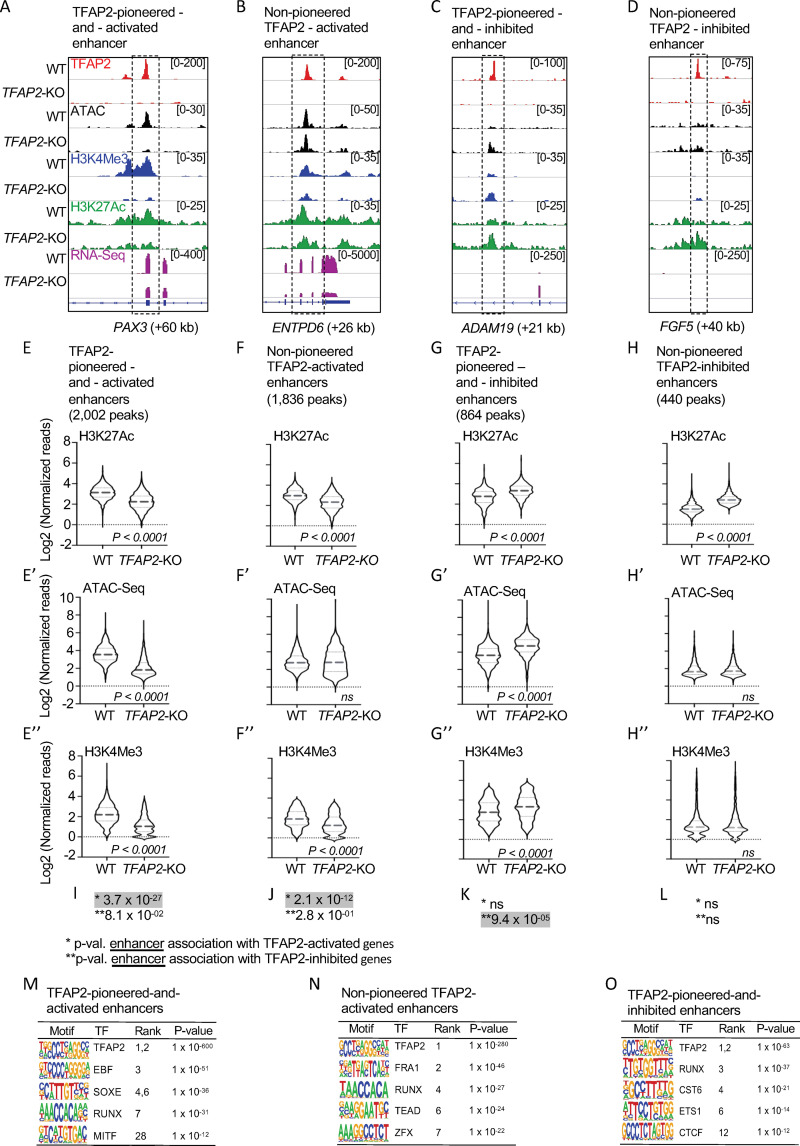
Fig. 3
(A-D) Screenshot of IGV genome browser (GRCH37/hg19), visualizing anti-TFAP2A CUT&RUN-seq (red), ATAC-seq (black), anti-H3K4Me3 CUT&RUN-seq (blue), anti-H3K27Ac CUT&RUN-seq (green) and RNA-seq (magenta) datasets at: (A) an TFAP2-pioneered-and-activated enhancer at the PAX3 (+60 kb) locus; (B) a non-pioneered TFAP2A-activated enhancer at the ENTPD6 (+26kb) locus; (C) an TFAP2-pioneered-and-inhibited enhancer at the ADAM19 (+21 kb) locus; and (D) a non-pioneered TFAP2A-inhibited enhancer at the FGF5 (+40kb) locus. Genotypes as labeled; y-axis in E applies to E-H, etc. (E-H?) Violin plots conveying normalized reads of (E-H) anti-H3K27Ac (two independent replicates), (E?-H?) ATAC-seq (four independent replicates) and (E?-H?) anti-H3K4Me3 (two independent replicates) CUT&RUN-seq at E-E?) TFAP2-pioneered-and-activated enhancers, (F-F?) non-pioneered TFAP2-activated enhancers, (G-G?) TFAP2-pioneered-and-inhibited enhancers, and (H-H?) non-pioneered TFAP2-inhibited enhancers. The number of peaks in each group is indicated. P-values shown were determined by Student?s t-test. (I-L) Hypergeometric analysis of TFAP2 regulated enhancers at TFAP2-activated (*) and TFAP2-inhibited (**) genes in WT cells (FDR < 0.05, |log2FC| > 1). ns; not significant. (M-O) Enrichment of transcription factor binding motifs at (M) TFAP2-pioneered-and-activated enhancers, at (N) non-pioneered TFAP2-activated enhancers and at (O) TFAP2-pioneered-and-inhibited enhancers as determined using HOMER motif analysis. P values were calculated using ZOOPS scoring (zero or one occurrence per sequence) coupled with hypergeometric enrichment analysis. TF; transcription factor.