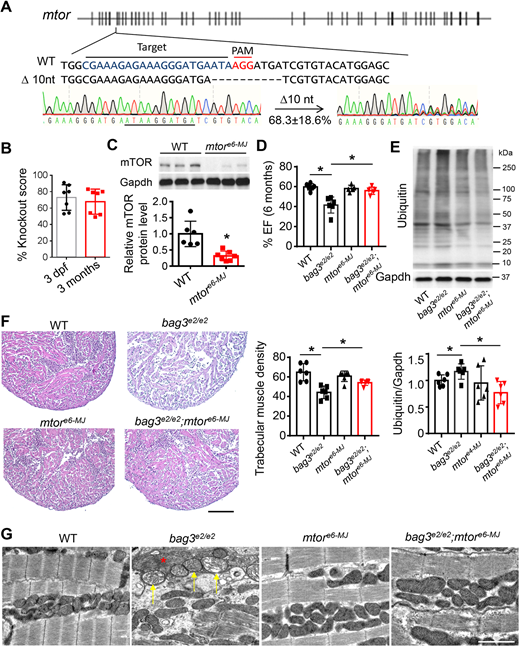
Fig. 3
Injection of the predicted MMEJ-inducing mtor-sgRNA exerted salutary modifier effects on bag3 cardiomyopathy at F0. (A) Design of the predicted MMEJ-inducing sgRNA sequence targeted to the exon 6 within the mtor gene (mtore6-MJ). Injection of mtore6-MJ sgRNA generated frame-shift mutant alleles, with 68.3% predicted to result from microhomology recombination (10-nucleotide deletion). (B) The mtor gene KO score (in %) in mtore6-MJ-injected fish embryos at 3 dpf. (C) Western blotting and quantification analysis of mTOR protein in the mtore6-MJ fish compared to non-injected WT controls at 3 dpf; n=6, one way-ANOVA. (D) Ejection fraction (EF) of the mtore6-MJ-injected bag3e2/e2 fish (mtore6-MJ;bag3e2/e2) compared to bag3e2/e2 mutant alone, mtore6-MJ and non-injected WT controls at 6 months; n=6, one-way ANOVA. (E) Western blot (top panel) and quantification analysis (below) of ubiquitylated protein levels in mtore6-MJ-injected bag3e2/e2 fish hearts compared to those non-injected controls at 6 months; n=6, one-way ANOVA. (F) Representative H&E staining images of the apex area (left panel) and quantification of the trabecular muscle density (right panel) from the mtore6-MJ;bag3e2/e2 fish compared to those of corresponding controls at 6 months; n=6, one-way ANOVA. Scale bar: 100 µM. (G) Confirmative TEM images of mtore6-MJ-injected bag3e2/e2 fish hearts (bag3e2/e2;mtore6−MJ) compared to those of corresponding controls (WT, bag3e2/e2 and mtore6−MJ) demonstrate largely restored mitochondrial swelling (arrows) and myofibril degeneration (asterisk) in the mtore6-MJ-injected bag3e2/e2 fish at 6 months. Scale bar: 2 µM; *P<0.05.

