
|
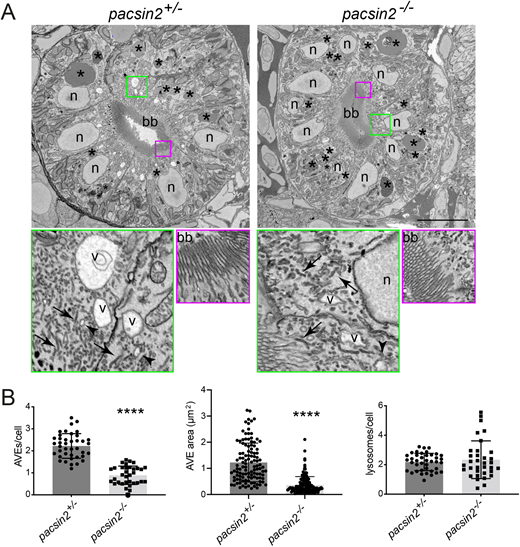
Fig. 5
Loss of Pacsin2 results in reduced abundance of the apical endocytic organelles in the proximal tubule. (A) Block-face SEM images of transverse proximal tubule sections from pacsin2+/− (left panels) and pacsin2−/− (right panels) 4 dpf larvae. Top panels show whole cross-section of the proximal tubule, bottom panels show enlarged boxed regions indicated in green and red. Top panels: scale bar: 10 µm. Green and red boxed areas=4 µm and 3 µm, respectively. bb, brush border; V, apical vacuolar endosome; N, nucleus; *, lysosomes; arrows, dense apical recycling tubules; arrowheads, endocytic vesicles. (B,C) Average number and size of AVEs, respectively, and (D) number of lysosomes per cell. Unpaired t-test, **** P<0.0001. For B and D, n=40 (pacsin2+/−) and 34 (pacsin2−/−). For C, n=114 (pacsin2+/−) and 136 (pacsin2−/−). Error bars=s.d.