Image
Figure Caption
Fig. 1
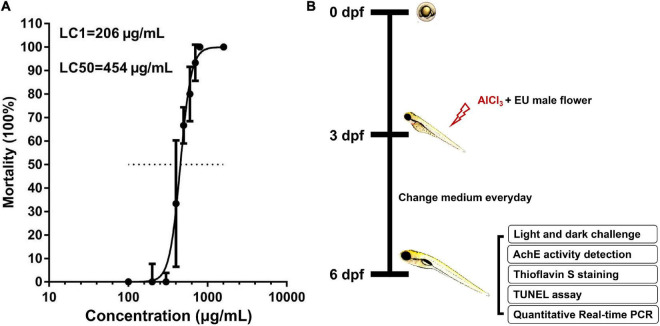
Mortality curve and experimental workflow chart. (A) Larval zebrafish were exposed to different concentrations of EUMF (100, 200, 300, 400, 500, 600, 700, 800, and 1,600 ?g/mL) from 3 to 6 dpf. The mortality was recorded within each group at 3, 4, 5, and 6 dpf. Dead larvae were judged using missing heartbeats. (B) Larvae at 3 dpf were co-exposed to AlCl3 and three different concentrations of EUMF from 3 to 6 dpf. At 6 dpf the zebrafish were subjected to a behavioral test. In addition, we also evaluated the AchE activity, A? deposition, and apoptosis in the brain and performed RT-qPCR.
Acknowledgments
This image is the copyrighted work of the attributed author or publisher, and
ZFIN has permission only to display this image to its users.
Additional permissions should be obtained from the applicable author or publisher of the image.
Full text @ Front. Mol. Neurosci.

