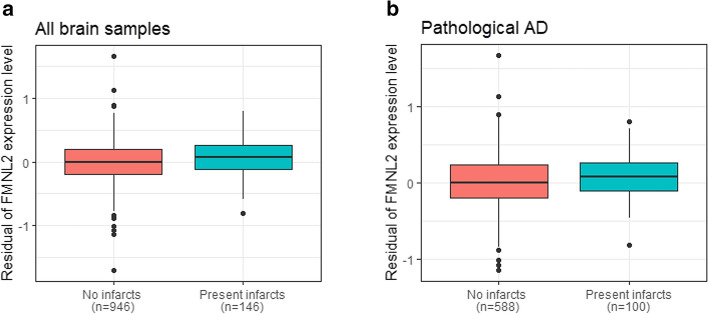
Fig. 1
FMNL2 expression level by brain infarcts. a Distribution of expression level of FMNL2 in those with gross chronic infarction in cortex compared to those without infarction was statistically significant (adjusted for age, sex, and processing factors b?=?1.024, pFDR?=?0.003). b Distribution of FMNL2 expression in those with pathological AD and gross chronic infarction in cortex compared to those with pathological AD and no infarction, in the dorsolateral prefrontal cortex from ROSMAP was statistically significant (adjusted b?=?0.792, p?=?0.025). A logistic regression was fitted for the brain infarcts as outcome and FMNL2 expression level (log2-tranformed normalized transcripts per million values) as exposure adjusted for age, sex, and processing factors. For visualization purposes, the residual of FMNL2 expression level (y-axis) was used to represent the residual of transcripts from fitting the linear regression on the FMNL2 expression level adjusted for age, sex, and processing factors, capturing variability in transcripts outcome not captured by known demographics or processing factors

