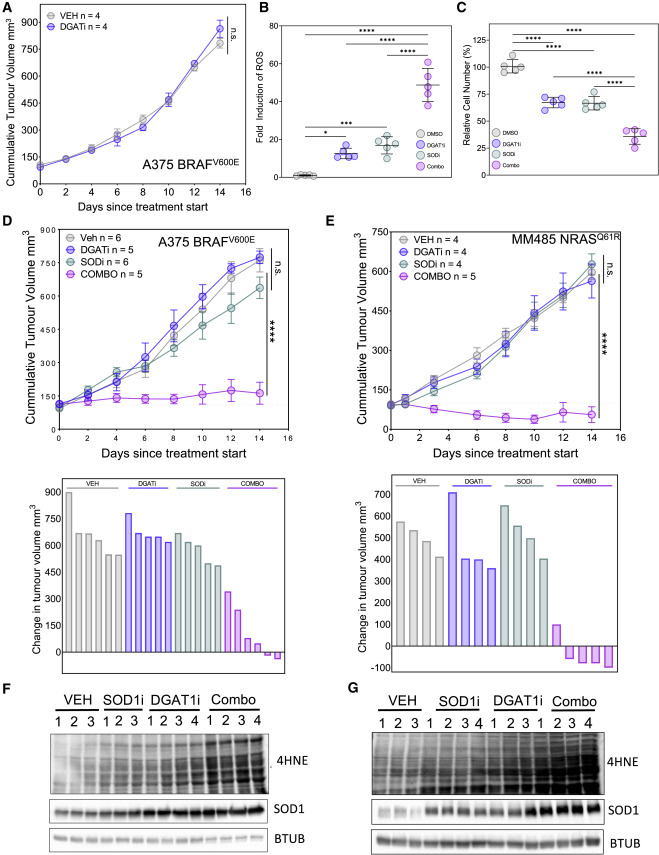
Fig. 6 Figure 6. Combined DGAT1 and SOD1 inhibition halts tumor growth (A) Nude mice bearing A375 tumors were treated (n = number of mice per group) with vehicle or A922500 (DGAT1i; 90 mg/kg/day) for 14 days. Data are presented as mean tumor volumes ±SD. (B) Quantification of ROS levels by DHE fluorescence in A375 cells following treatment with either A922500 or ATN-224 (SOD1i) alone or in combination (combo). Fold change relative to DMSO (mean ± SD, n = 5). (C) Relative number of A375 cells following treatment with either A922500 or ATN-224 alone or in combination. Fold change relative to DMSO (mean ± SD, n = 5). (D and E) Nude mice bearing A375 tumors (D) or MM485 tumors (E) were treated (n = number of mice per group) with vehicle, A922500 (90 mg/kg/day) or TTM (SODi; 5 mg/kg/day) alone or in combination for 14 days. Data are presented as mean tumor volumes ±SD (top) or change in individual tumor volume (bottom). (F and G) 4HNE protein conjugate abundance and protein expression of SOD1 in A375 tumors (F) or MM485 tumors (G) treated with vehicle, A922500, or TTM alone or in combination. (B?E) For significance: ?p < 0.05, ???p < 0.001, and ????p < 0.0001.
Image
Figure Caption
Acknowledgments
This image is the copyrighted work of the attributed author or publisher, and
ZFIN has permission only to display this image to its users.
Additional permissions should be obtained from the applicable author or publisher of the image.
Full text @ Cell Rep.

