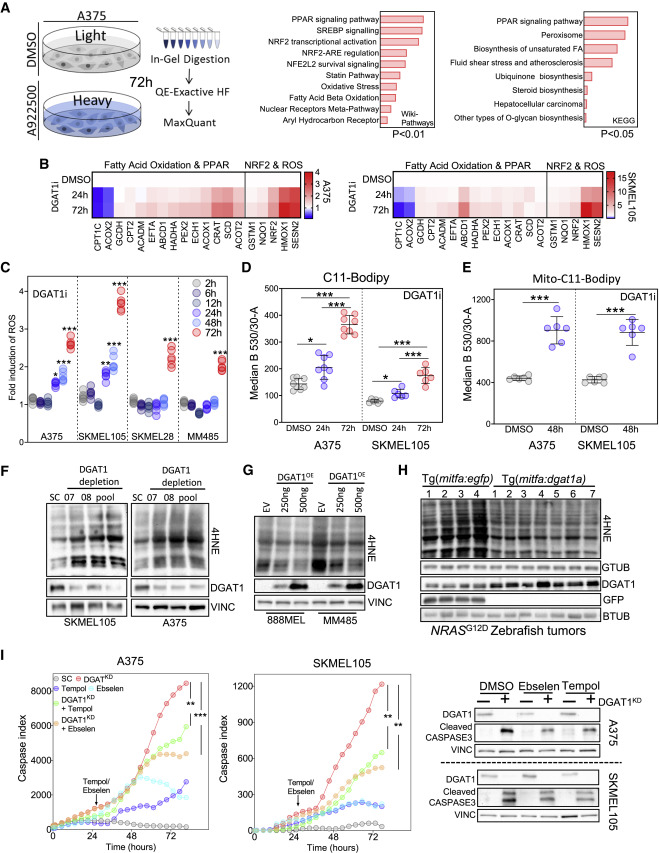
Fig. 5 Figure 5. DGAT1 promotes survival of melanoma cells through suppressing ROS generation (A) Total proteomics workflow (left). GEO of up-regulated proteins (114) ranked by combined score (wikipathways) or log-adjusted p values (metascape, right). (DMSO n = 3, A922500 n = 3). (B) RT-qPCR analysis following A922500 treatment. Fold change relative to DMSO (mean, n = 3). (C) ROS levels quantified using dihydroethidium (DHE) fluorescence following A922500 (DGAT1i) treatment. Fold change relative to DMSO (n > 4). (D) C11-Bodipy staining following A922500 treatment. Mean fluorescence determined using FACS (mean ± SD, n > 6). (E) Mito-C11-Bodipy staining following A922500 treatment. Mean fluorescence determined using FACS (mean ± SD, n > 6). (F) 4-Hydroxynonenal (4HNE) protein conjugate abundance and protein expression of DGAT1 following transfection with either DGAT1-targeting siRNA or a scrambled control for 48 h. (G) 4HNE protein conjugate abundance and protein expression of DGAT1 following transfection with either DGAT1 over-expression vector or an empty vector control for 48 h. (H) 4HNE protein conjugate abundance and protein expression of Dgat1 and GFP in NRASG12D-positive EGFP-expressing (n = 4) and NRASG12D-positive Dgat1a-over-expressing (n = 7) tumors. (I) Cleaved-caspase index following transfection of a DGAT1-targeting or scrambled siRNA. At 24 h, cells were treated with/without Tempol or Ebselen (mean, n = 3, outer). Corresponding protein expression of DGAT1 and cleaved caspase-3 (inner). (C?E and I) For significance: ?p < 0.05, ??p < 0.01, and ???p < 0.001.
Image
Figure Caption
Acknowledgments
This image is the copyrighted work of the attributed author or publisher, and
ZFIN has permission only to display this image to its users.
Additional permissions should be obtained from the applicable author or publisher of the image.
Full text @ Cell Rep.

