IMAGE

FIGURE 2

ID
ZDB-IMAGE-220525-6
Source
Figures for Lu et al., 2022
Image
Figure Caption

FIGURE 2

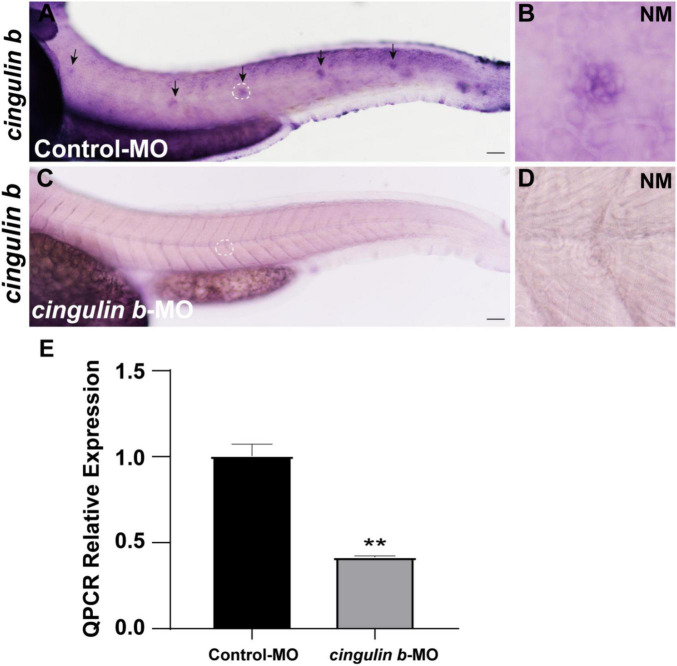
The efficacy of cingulin b-MO. (A–D) The expression of cingulin b is significantly reduced in the cingulin b-MO morphants (C), n = 8 compared to that in the Control-MO embryos (A)n = 5. (E) Quantitative analysis on the level of cingulin b between Control-MO and cingulin b-MO groups (n = 8 in each group). Data are shown in mean ± SEM, **p < 0.01. Scale bars in panel (A,C) mark 50 μm. The black arrows in panel (A) indicate the neuromasts, and the white dotted lines labeled neuromasts in panel (A,C) are magnified in panel (B,D), respectively.

Acknowledgments
This image is the copyrighted work of the attributed author or publisher, and ZFIN has permission only to display this image to its users. Additional permissions should be obtained from the applicable author or publisher of the image. Full text @ Front. Mol. Neurosci.