
Image
|
Figure Caption
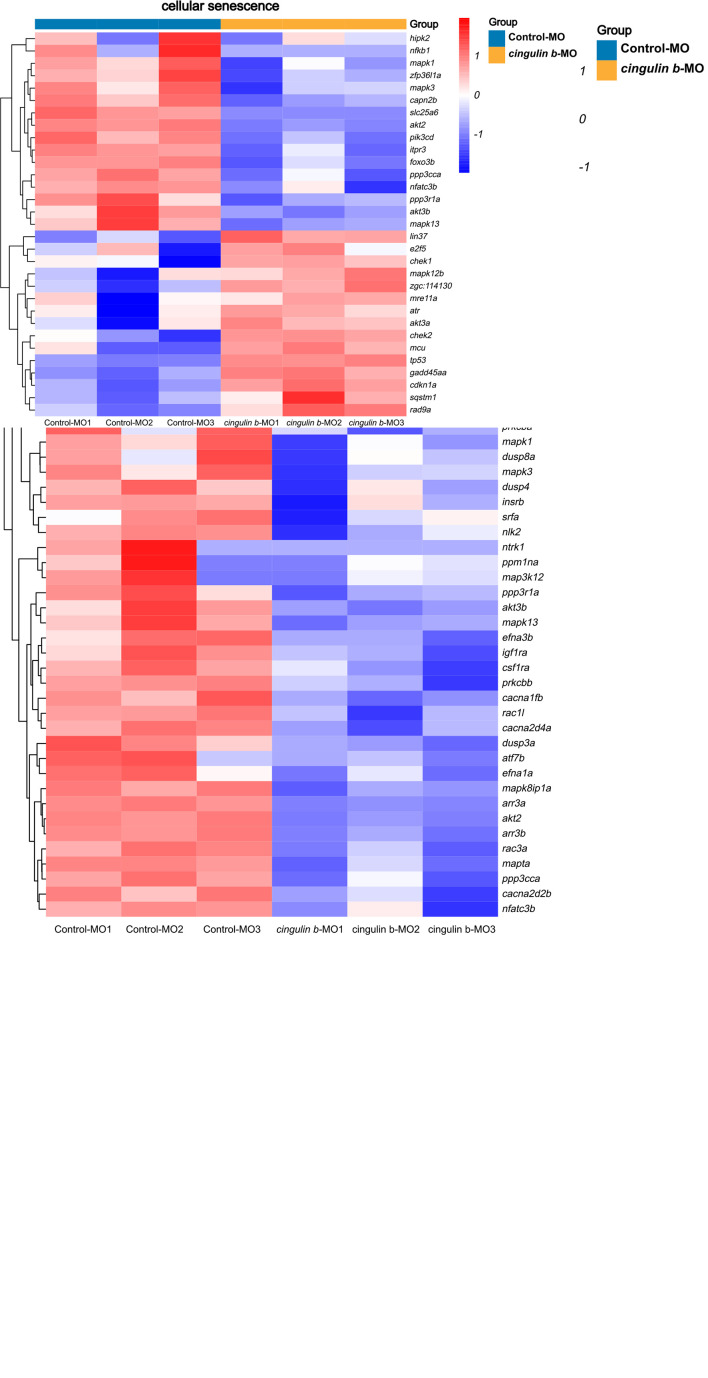
FIGURE 8
Heatmap analysis of MAPK signaling pathway and cellular senescence signaling pathway in comparison between Control-MO embryos and
Acknowledgments
This image is the copyrighted work of the attributed author or publisher, and
ZFIN has permission only to display this image to its users.
Additional permissions should be obtained from the applicable author or publisher of the image.
Full text @ Front. Mol. Neurosci.