Image
Figure Caption
Fig. 1
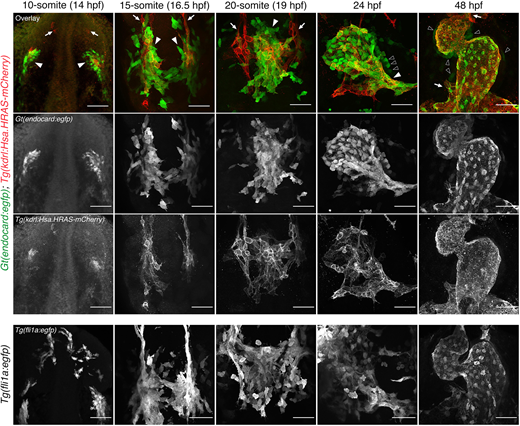
Time-course analysis of Gt(endocard:egfp) fluorescence demonstrates enriched endocardial expression at somitogenesis stages in the zebrafish embryo. Immunofluorescence staining of Gt(endocard:egfp); Tg(kdrl:Hsa.HRAS-mCherry) and Tg(fli1a:egfp) embryos from 10?s through to 48?hpf. Anterior to the top. Anterior views at 48?hpf, all other images show dorsal views. White arrowheads label kdrl+/endocard:egfp+ endocardial cells. White arrows label kdrl+/endocard:egfp? vascular endothelial cells. Black arrowheads label presumptive myocardial cells. Scale bars: 50??m.

