IMAGE

Fig. 4

ID
ZDB-IMAGE-220505-15
Source
Figures for Dzementsei et al., 2022
Image
Figure Caption

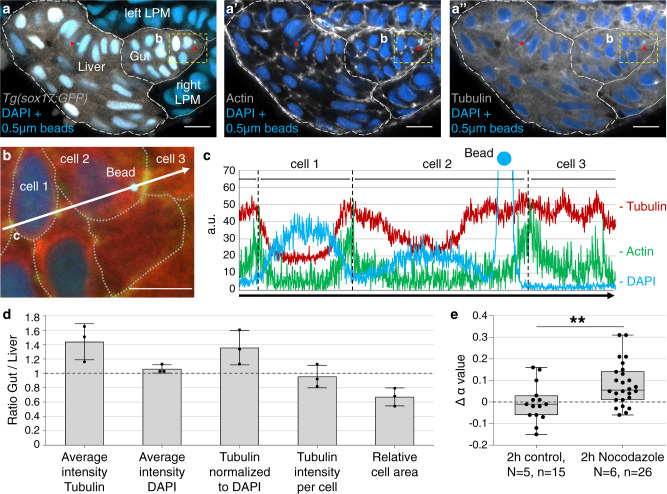
Fig. 4 Microtubules surround injected nanoparticles and their concentration is increased in gut progenitors.

aa” Transverse section of a 30 hpf tg(sox17:GFP) embryo microinjected with 0.5 µm fluorescent polystyrene beads (light blue dots next to red arrowheads) showing Phalloidin staining of actin filaments (gray in (a’)) and β-tubulin staining to visualize microtubules (gray in (a”)). Fluorescent emission of microinjected beads and nuclear DAPI occurs at similar wavelengths; beads are detected by size and high signal intensity. Scale bar: 10 µm. b Magnification of cellular bead location (yellow dashed rectangle in (aa”)). Cell borders are outlined based on the presence of cortical actin (dashed lines). Scale bar: 20 µm. c Intensity profile of actin, tubulin, and DAPI along the white arrow in (b). The high peak in the DAPI channel indicates bead position. d Ratio of tubulin levels between gut and liver determined from tissue volumes with a typical linear dimension of 20 µm (see “Methods” and Supplementary Fig. 5). The average intensity represents the signal intensity normalized to tissue area (tubulin) or nuclear area (DAPI) for each optical section. Tubulin intensity per cell is calculated by normalizing the average Tubulin intensity to the nuclei number. The relative cell area was obtained by normalizing the volume of the respective tissue to nuclei number. Error bars represent one standard deviation, number of analyzed embryos = 3. e α-value changes after 2 h of 2 µM Nocodazole treatment (green; mean+SD = 0.082 ± 0.1) and in DMSO controls (blue; mean+SD = −0.004 ± 0.09). N = number of embryos, n = number of measured nanoparticles; P value calculated using unpaired equal variance two-tailed t test; **P = 0.0086.

Acknowledgments
This image is the copyrighted work of the attributed author or publisher, and ZFIN has permission only to display this image to its users. Additional permissions should be obtained from the applicable author or publisher of the image. Full text @ Commun Biol