
Image
|
Figure Caption
Figure 2
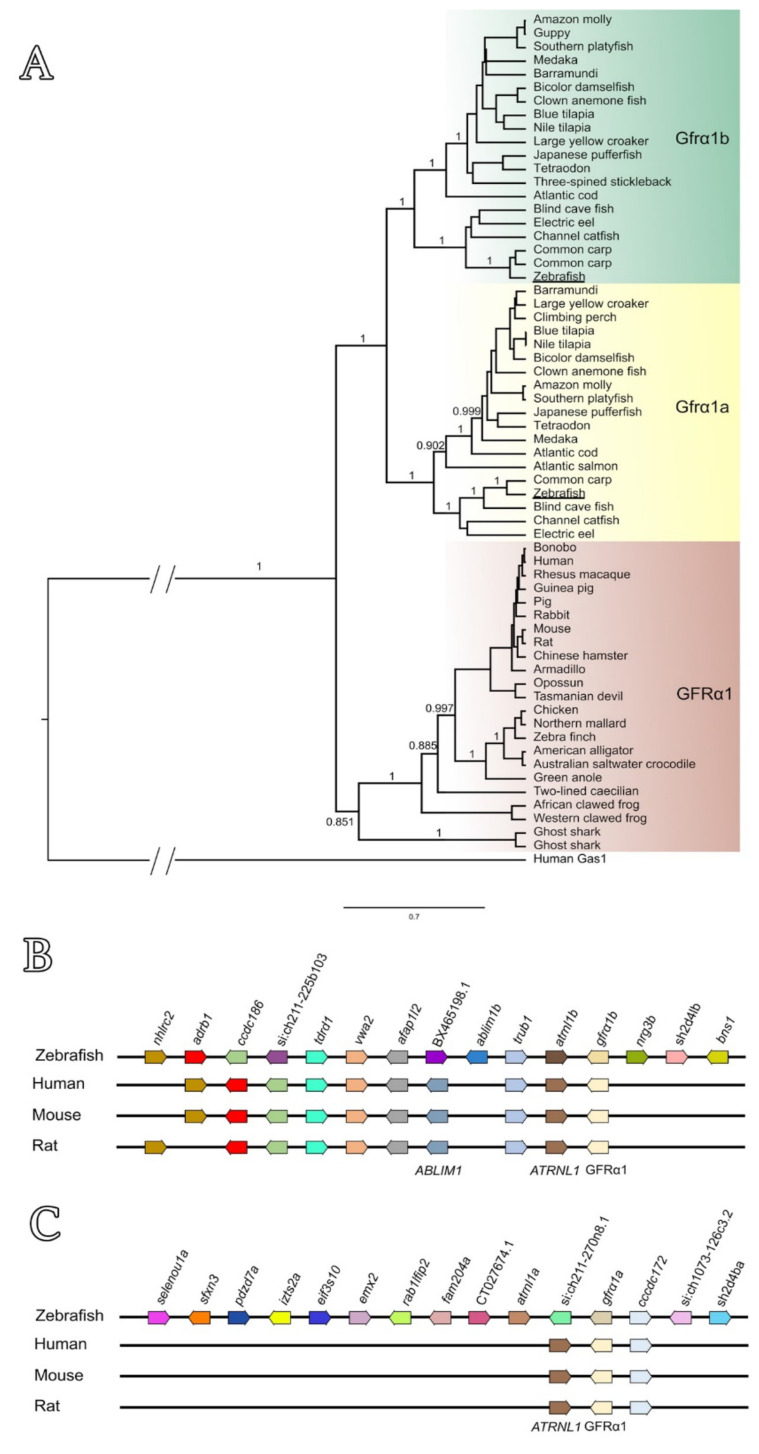
Figure 2. (A) Phylogenetic analysis of GFR?1 predicted amino acid sequences across vertebrates. Zebrafish Gfr?1a and 1b (both underlined) are clustered with other fish-specific Gfr?1a (yellow box) and Gfr?1b (green box) sequences, respectively, forming two separate subclades. Note that the GFRA1 sequences from other vertebrates (mammals, birds, reptiles, amphibians and Chondrichthyes) formed a separate clade (brown box). Branch values represent posterior probabilities obtained by Bayesian analysis (see Table S1). (B,C) Genomic organization and synteny comparisons among human GFRA1, rodents Gfr?1 and zebrafish gfr?1b (B) or zebrafish gfr?1a (C). The syntenic regions were analyzed according to the alignment of the target genes and genomic annotation available in the GenBank database (National Center for Biotechnology Information and Ensembl).
Acknowledgments
This image is the copyrighted work of the attributed author or publisher, and
ZFIN has permission only to display this image to its users.
Additional permissions should be obtained from the applicable author or publisher of the image.
Full text @ Cells