Image
Figure Caption
Figure 8
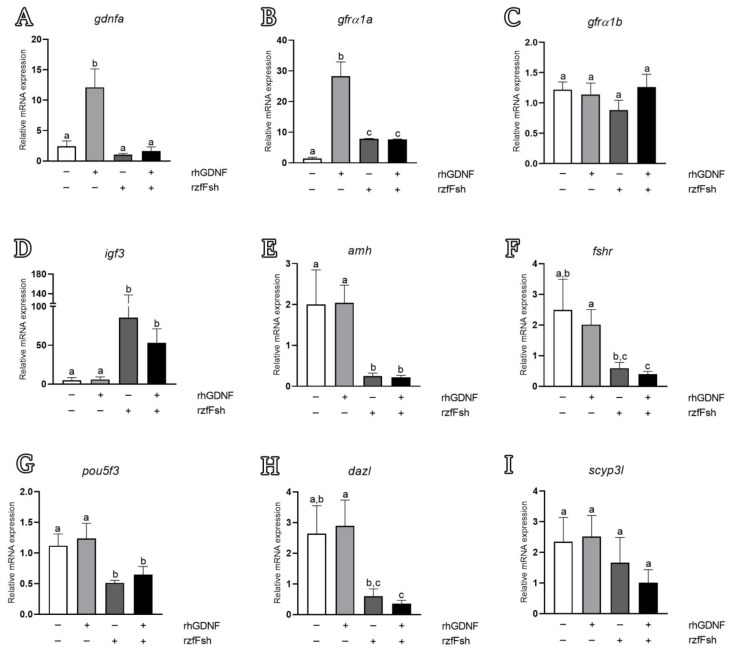
Figure 8. Relative mRNA levels of genes related to Gdnf signaling (gdnfa, gfrα1a and gfrα1b) (A–C), Sertoli cell growth factors (igf3 and amh) (D–E), Fsh signaling (fshr) (F) and germ cell markers (undifferentiated spermatogonia—pou5f3 (G); differentiated spermatogonia and preleptotene spermatocytes—dazl (H); and primary spermatocytes—scyp3l (I)). Testicular explants were cultivated for 7 days with rhGDNF, rzfFsh or both (rhGDNF + rzfFsh). The relative mRNA levels were normalized with the β-actin levels. Bars represent the mean ± SEM (n = 20). One-way ANOVA followed by the Student–Newman–Keuls test, in which different letters denote significant differences (p < 0.05) among treatment conditions.
Acknowledgments
This image is the copyrighted work of the attributed author or publisher, and
ZFIN has permission only to display this image to its users.
Additional permissions should be obtained from the applicable author or publisher of the image.
Full text @ Cells

