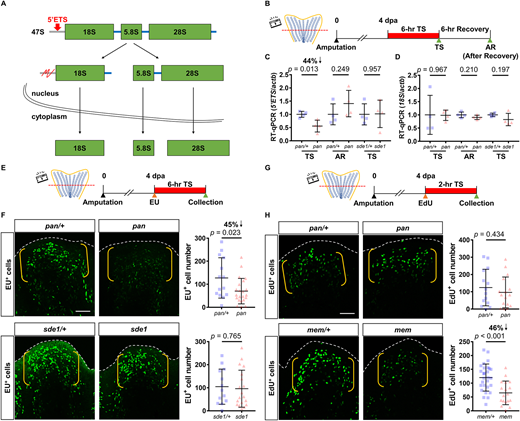
Fig. 5 Ddx52 maintains 47S pre-rRNA and bulk RNA transcriptions in proliferating tissues. (A) Illustration depicting the processing of ribosomal RNAs. Once transcribed, the 47S pre-rRNA is immediately processed into 18S, 5.8S and 28S rRNAs. Red arrow points to the 5′-external transcribed space (5′ETS), the level of which often serves as a readout for the quantity of 47S pre-rRNA. (B) Timeline of the temperature shift experiment during tailfin regeneration. AR, after recovery at 26°C; dpa, days post-amputation; TS, temperature shift. Red bar indicates time at 34°C. (C) RT-qPCR assay indicating a marked reduction in the 5′ETS level after a 6-h incubation at 34°C. qPCR results were normalized to actb (n=4 per group; mean±s.e.m.; two-tailed Student's t-test). (D) RT-qPCR assay indicating no change in the 18S level after a 6-h incubation at 34°C. qPCR results were normalized to actb (n=4 per group; mean±s.e.m.; two-tailed Student's t-test). (E) Timeline of the temperature shift and EU assay during tailfin regeneration. Orange arrowhead marks the EU injection time. TS, temperature shift. Red bar indicates time at 34°C. (F) Whole-mount EU staining of pan and sde1 tailfin regenerates at 4 dpa after a 6-h incubation at 34°C. White dashed lines outline the distal margin of the fin tissue. Yellow brackets mark the blastema compartment. Scale bar: 50 μm. Graphs show quantification of EU+ cells in the lateral 2nd bony ray (n=24 pan/+, 22 pan; 13 sde1/+, 19 sde1; mean±s.d.; two-tailed Student's t-test). (G) Timeline of the temperature shift and EdU assay during tailfin regeneration. Orange arrowhead marks the EdU injection. Red bar indicates time at 34°C. (H) Whole-mount EdU staining of pan and mem tailfin regenerates at 4 dpa after a 2-h incubation at 34°C. White dashed lines outline the distal margin of the fin tissue. Yellow brackets mark the blastema compartment. Scale bar: 50 μm. Graphs show quantification of EdU+ cells in the lateral 2nd bony ray (n=14 pan/+, 16 pan; 28 mem/+, 18 mem; mean±s.d.; two-tailed Student's t-test).
Image
Figure Caption
Figure Data
Acknowledgments
This image is the copyrighted work of the attributed author or publisher, and
ZFIN has permission only to display this image to its users.
Additional permissions should be obtained from the applicable author or publisher of the image.
Full text @ Development

