IMAGE

FIGURE 1

ID
ZDB-IMAGE-220420-37
Source
Figures for Martins et al., 2022
Image
Figure Caption

FIGURE 1

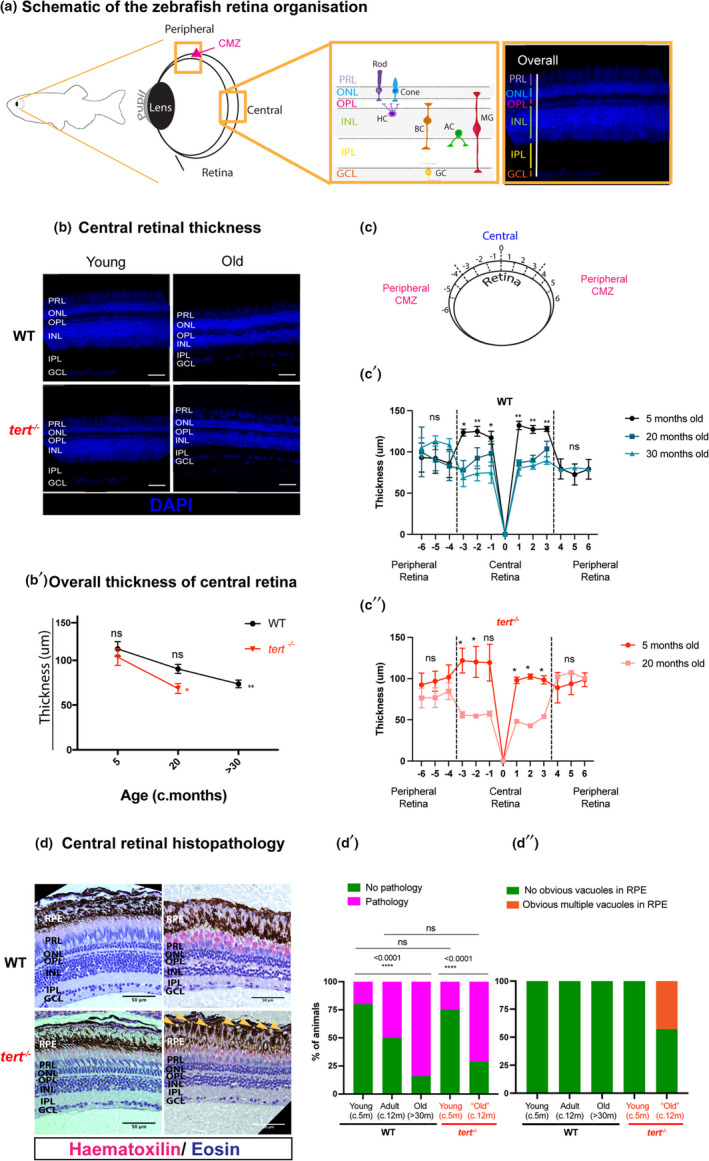
Zebrafish retina ageing is characterised by tissue thinning and morphological alterations, independently of telomerase. (a) Schematic figure of the zebrafish retina highlighting the peripheral, including the proliferative ciliary marginal zone (CMZ), and central retina, with respective layers and cell types (inset). (b) Central retina stained with DAPI in both WT and tert−/−, at young (5 months) and old ages (>30 months in WT and c. 20 months in tert−/−). Scale bars: 20 μm. (b’) Quantifications of retina thickness by DAPI staining. N = 3 per group. Error bars represent the standard error of the mean (SEM). (c) Schematic figure of the retina showing the twelve regions where retina thickness was quantified (6 central and 6 peripheral regions). (c’) Spider plots showing the thickness across the WT retina at 5 months, 20 months and 30 months. (c’’) Spider plots showing the thickness across the tert−/− retina at 5 and 20 months. (d) H&E staining in both WT and tert−/−, at young (c. 5 months) and old ages (>30 months in WT and c. 12 months in tert−/−). Scale bars: 50 μm. (d’–d’’) Qualitative assessment of H&E staining in the retina, (d’) considering overall pathology signs and (d’’) the presence of vacuoles in the RPE layer. N = 4–7 per group. GCL, ganglion cell layer; IPL, inner plexiform layer; INL, inner nuclear layer; OPL, outer plexiform layer; ONL, outer nuclear layer; PRL, photoreceptor layer. p‐value: *<0.05; **<0.01; ***<0.001

Acknowledgments
This image is the copyrighted work of the attributed author or publisher, and ZFIN has permission only to display this image to its users. Additional permissions should be obtained from the applicable author or publisher of the image. Full text @ Aging Cell