
|
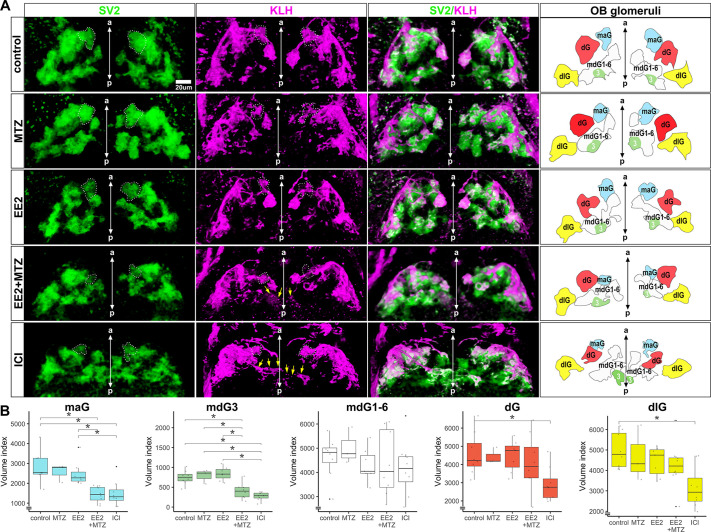
Fig. 4.
EROB cell ablation impairs the development of olfactory glomeruli. (A) Representative 3D images of olfactory glomeruli (SV2, green), OSNs (KLH, magenta) and merged image of SV2/KLM in control, MTZ, EE2, EE2+MTZ or ICI-exposed 4 dpf ERE:mCherry embryos. Right-end panels are the illustrations of OB glomeruli map generated based on the outlines and positions of five selected olfactory glomeruli in the representative 3D images: maG, blue; dG, red; dlG, yellow; mdG1-6, white; mdG3, green. The midlines are indicated with anterior-posterior (a-p) axis in the images. White dotted lines in SV2 and KLH images show maG; green coloured areas in OB glomeruli map show mdG3; yellow arrows in KLH images show altered axonal extensions of OSNs. (B) Relative volumes of the five different selected glomeruli. n=8 for control, EE2, EE2+MTZ and ICI, n=3 for MTZ alone. Data are mean�s.e.m. shown. *P<0.05 (ANOVA with Tukey post-hoc test). Boxplots show the median with 1st and 3rd quartiles of the distribution. Whiskers extend to the minimum and maximum of the data range within 1.5� the interquartile range; data beyond that range are defined as outliers and plotted individually in black. Overlaying the boxplot is a scatterplot in semi-transparent showing all individual observations.