
|
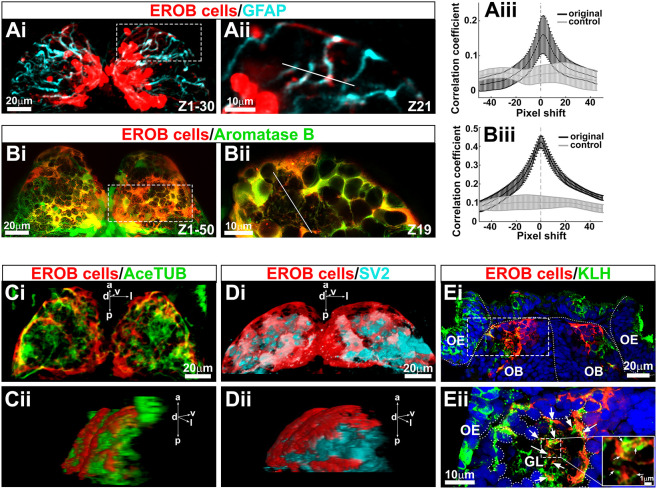
Fig. 2.
EROB cells are GFAP- and aromatase B-expressing glia that interact with olfactory sensory neurons at olfactory glomeruli. (Ai) Confocal z-projection images of EROB cells (mCherry, red) and GFAP (cyan) in an EE2-exposed 4 dpf ERE:mCherry embryo. (Aii) An optical section image (1.5 �m step size) magnified from the area marked with white dotted rectangle in Ai. (Aiii) Pearson's correlation coefficient in two dimensions for EROB cells versus GFAP, plotted against image displacement in the x-direction (black). Control corresponds to image sets with one channel rotated by 90� (light grey). The peak correlation coefficient (PCC) was found at a 1.5 pixel shift (0.22 �m/pixel size), suggesting a close localisation of EROB cell and GFAP in the same projection (data are mean�s.e.m.). (Bi) Confocal z-projection images of 4 dpf EE2-exposed double transgenic ? Tg(ERE:mCherry)�Tg(cyp19a1b:GFP) ? embryo. (Bii) One optical section image (0.7 �m step size) magnified from the area marked with white dotted rectangle in Bi. (Biii) Pearson's correlation coefficient in two dimensions for EROB cells versus aromatase B. The PCC was at 0 pixel shift, indicating co-localisation of EROB cell and aromatase B. *P<0.05 (t-test for significant difference from the rotated control image sets, grey). Data are mean�s.e.m. (n=3). (Ci,Cii) A 3D image of EROB cells (red) and acetylated tubulin-positive axonal projections (green) in the OB (Ci, dorsal view; Cii, a 50� rotated view of Ci). (Di,Dii) A 3D image of EROB cells (red) and olfactory glomeruli stained with SV2 antibody (cyan) (Di, dorsal view; Dii, a 45� rotated view of Di). (Ei) Frontal cryosection image of EROB cells (red), OSNs (KLH, green) and nuclei (Hoechst, blue). White dotted lines indicate the outline of the olfactory epithelia (OE), olfactory bulb (OB) and midline. (Eii) A magnified image of a glomerulus (GL) from the area indicated with a white dotted rectangle in Ei. Arrows indicate EROB cell?KLH+ OSN interactions. Outline of the GL is indicated with white dotted freeform line. Magnified image of a central area of the GL is inserted on the right, showing that EROB cells (red) tightly intermingle with OSNs (green) within the GL (indicated with white arrows). a, anterior; d, dorsal; l, lateral; p, posterior; v, ventral.