
|
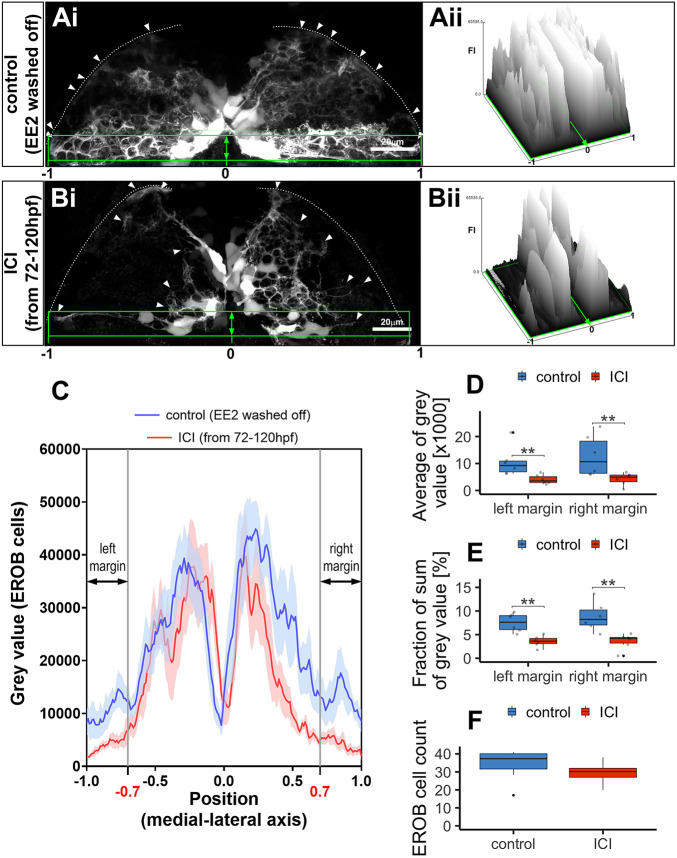
Fig. 3.
Estrogens regulate EROB cell projections. (Ai,Bi) Confocal z-projection image of EROB cells in EE2-exposed (from 1 hpf to 72 hpf, then washed off) control (Ai) or subsequently an ER antagonist, ICI 182,780 (ICI, 10 �M)-treated (from 72 hpf to 120 hpf) (Bi) 5 dpf ERE:GFP embryo (see details in Materials and Methods). Arrowheads show the distal end of the EROB cells; white dotted line indicates the pia of the OB; green rectangles highlight EROB cell margins. (Aii,Bii) Surface plots of fluorescence intensity (FI) of GFP signals (EROB cells) in the EROB cell margins in control (Ai) and ICI-treated (Bi) embryos. The surface plots are shown along the width of the EROB cell margin, adjusted by the position of the midline as ?0? and the positions of lateral ends as ??1 (left)? or ?1 (right)?. (C) The intensity plots of GFP signals (EROB cells) in the EROB cell margin in control (blue) and ICI (red) embryos. X-axis is adjusted as described above. Data are mean�s.e.m., n=6 each. Black double arrows indicate both edges of the EROB cell margin, at the positions of [?1:?0.7] (left margin) and [0.7:1] (right margin). (D,E) The average of grey value and sum of grey value (percentage of total grey value in each embryo) of left and right margin (n=6 each). **P<0.01 (Mann?Whitney U-test). (F) The total EROB cell count (n=8, P=0.19, t-test). Boxplots show the median (middle black bar) with 1st and 3rd quartiles of the distribution. Whiskers extend to the minimum and maximum of the data range within 1.5� the interquartile range; data beyond that range are defined as outliers and plotted individually in black. Overlaying the boxplot is a scatterplot in semi-transparent showing all individual observations.