IMAGE

FIGURE 3

ID
ZDB-IMAGE-220406-24
Source
Figures for Dong et al., 2022
Image
Figure Caption

FIGURE 3

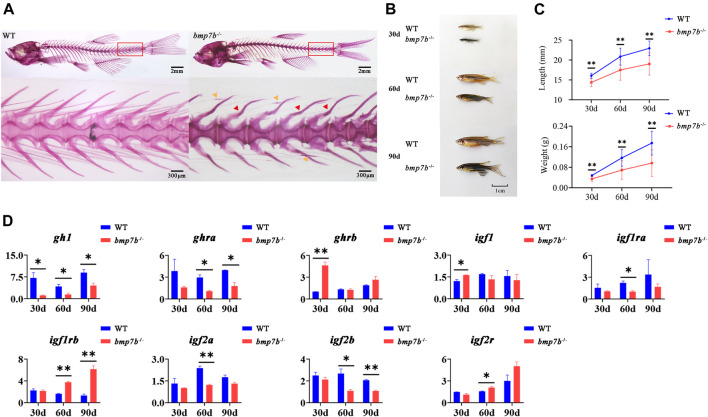
The bone and growth phenotype, and gene expression differences between the wild-type and bmp7b-/- zebrafish. (A) Alizarin red staining for mineralized bones at 3 months old fish. The red arrow indicates the severely curved part of the haemal arches, and the yellow arrow indicates the nodular part of the intermuscular bone. (B) The external physical characteristics. (C) The differences of body length and weight. (D) Quantitative expression analysis of growth related genes. Statistically significant differences are marked as *p < 0.05 and **p < 0.01.

Figure Data
Acknowledgments
This image is the copyrighted work of the attributed author or publisher, and ZFIN has permission only to display this image to its users. Additional permissions should be obtained from the applicable author or publisher of the image. Full text @ Front Cell Dev Biol