IMAGE

FIGURE 3

ID
ZDB-IMAGE-220403-40
Genes
Source
Figures for Qian et al., 2022
Image
Figure Caption

FIGURE 3

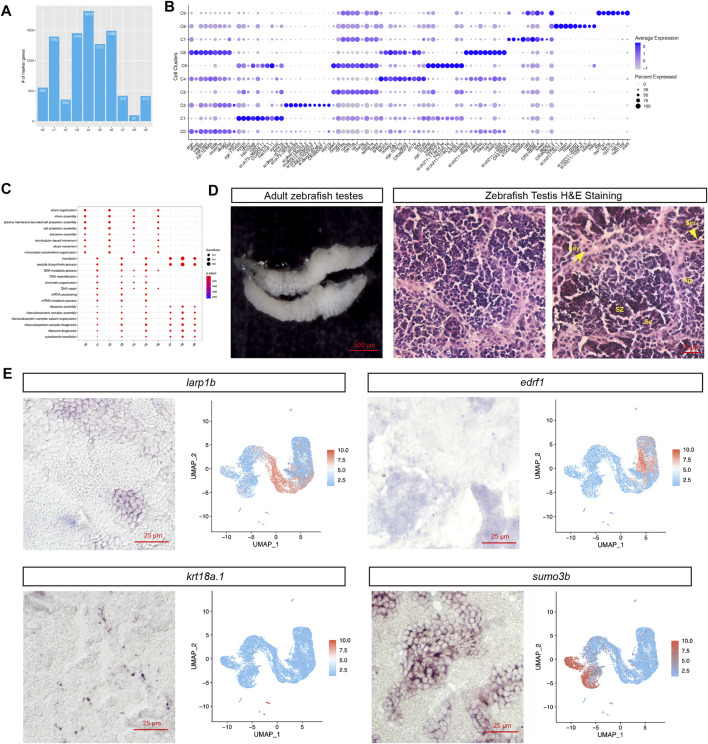
Studies of novel marker genes for each cell population. (A) Distribution of the number of marker genes in each cell population. (B) Dotplot visualization of top 10 marker genes for each cell cluster. (C) GO term enrichment analysis of the marker genes. (D) H&E staining of different cell types (Ser, Sertoli cell; Sg, Spermatogonia; Sc, Spermatocyte; SZ: spermatozoa; Ley: Leydig cell). (E) RNA in situ hybridization of novel marker genes. (For each marker gene, both of the ISH experimental result (Left) and scRNA-seq UMAP representation of gene expression were presented (Right))

Figure Data
Acknowledgments
This image is the copyrighted work of the attributed author or publisher, and ZFIN has permission only to display this image to its users. Additional permissions should be obtained from the applicable author or publisher of the image. Full text @ Front Genet