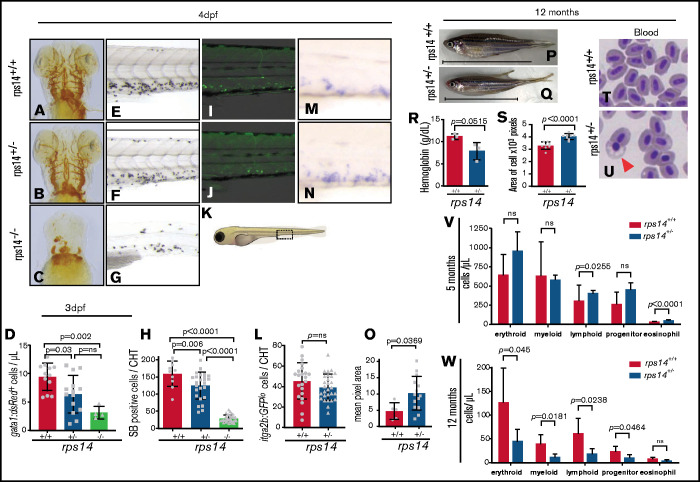
Figure 1.
Rps14 stable mutants show dose-dependent effects on hematopoiesis in embryos. (A-C) Assessment of hemoglobinized cells with o-dianisidine staining. Ventral views of the head in 4-dpf embryos. Rps14−/− zebrafish showed profound loss of hemoglobinized cells (C) and developmental anomalies. Rps14+/− were indistinguishable from their WT siblings by microscopy (A-B). (D) Number of erythroid cells by flow cytometry of individual Tg(gata1:dsRed);Rps14+/− embryos at 3 dpf. There was an allelic dose-dependent effect on the dsRed-expressing number of cells. (E-G) SB-stained 4-dpf embryos for granulocytes. (H) Quantification of SB+ cells. (K) Region of CHT depicted in cartoon (adapted from Lizzy Griffiths with permission). SB staining shows an allelic dose-dependent effect of Rps14. (I-J) Lateral views of the CHT of 4dpf Rps14 mutant fish carrying the itga2b:GFP transgene, labeling HSPCs that reside in the CHT. (L) Quantitation of stationary GFPlo cells in the CHT. (M-N) Expression of c-myb by in situ hybridization in 4-dpf embryos. (O) In contrast to itga2b-GFP, c-myb expression is increased in the CHT, quantified by median expression intensity in CHT.58 (P-Q) Lateral views of 12-month-old adult fish show the decreased size of heterozygotes. The anterior faces left and the dorsal side faces upward. The horizontal line shows the body length excluding the tail. (R) Quantification of hemoglobin concentration. (S) Analysis of cell size. Red blood cells were significantly larger in Rps14+/− mutants compared with siblings. (T-U) Micrographs of blood smears from Rps14+/− and WT siblings; the arrowhead indicates poorly hemoglobinized erythroid cell in Rps14+/−. (V-W) Absolute number of cells per microliter of different cell types in the kidney marrow of 5- and 12-month-old fish, showing progressive differences between heterozygous rps14 mutants and their WT siblings. Statistical comparison by 1-way ANOVA with Tukey’s multiple-comparisons test (D,H) or unpaired Student t test. Original magnification x100 for panels T and U.

