IMAGE

Fig. 2

ID
ZDB-IMAGE-220328-6
Source
Figures for Kuang et al., 2022
Image
Figure Caption

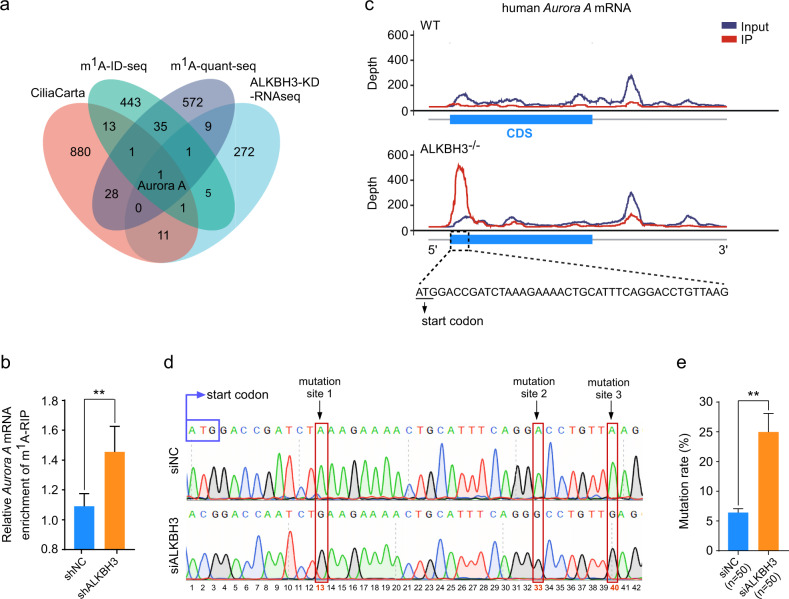
Fig. 2 ALKBH3 removes m<sup>1</sup>A sites on <italic>Aurora A</italic> mRNA.

a Venn diagram showing the overlapped transcripts from the databases of CiliaCarta, m1A-ID-seq, m1A-quant-seq, and RNA-seq in ALKBH3-KD cells. KD, knockdown. b Cells infected with lentivirus carrying shRNA targeting negative control (NC) or ALKBH3 were subjected to m1A RNA immunoprecipitation-qPCR analysis (m1A-RIP). m1A levels of Aurora A mRNA in control and ALKBH3-depleted cells were measured. c Peak-calling analysis of specific m1A peaks of Aurora A mRNA in wild-type and ALKBH3 knockout HEK-293T cells. d Sanger sequencing of Aurora A PCR products amplified from cDNAs that were reverse-transcripted by RT-1306 in the control and ALKBH3-depleted cells. Mutations at the m1A site are highlighted with red box. e Mutation rates at m1A sites of Aurora A mRNA in the indicated group are shown. Data are presented as the means ± SD from at least three independent experiments. Student’s t-test; **P < 0.01.

Acknowledgments
This image is the copyrighted work of the attributed author or publisher, and ZFIN has permission only to display this image to its users. Additional permissions should be obtained from the applicable author or publisher of the image. Full text @ Cell Discov