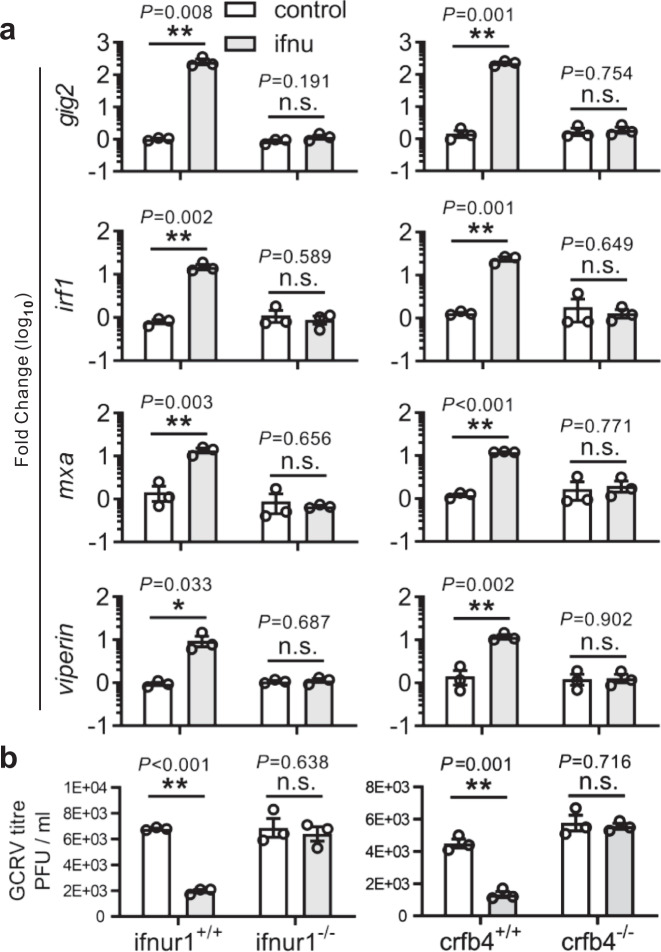
Fig. 4 Analyses of ISG expression (a) and viral titer (b) in ifnur1 and crfb4 deficiency and WT zebrafish stimulated by IFN-?. Embryos (n = 150) at one-cell stage were micro-injected with IFN-? or control plasmids for 72 h, and hatched zebrafish larvae (n = 33) were collected for quantitative RT-PCR detection or infected with GCRV for 24 h to determine viral titer. The expression of ISGs was normalized against gapdh. Data are expressed as mean ± SEM from three independent experiments. The two-tailed Student?s t test was used to determine the statistical significance, with * indicating P < 0.05, and ** indicating P < 0.01, n.s. non-significancy.
Image
Figure Caption
Acknowledgments
This image is the copyrighted work of the attributed author or publisher, and
ZFIN has permission only to display this image to its users.
Additional permissions should be obtained from the applicable author or publisher of the image.
Full text @ Nat. Commun.

