
Image
|
Figure Caption
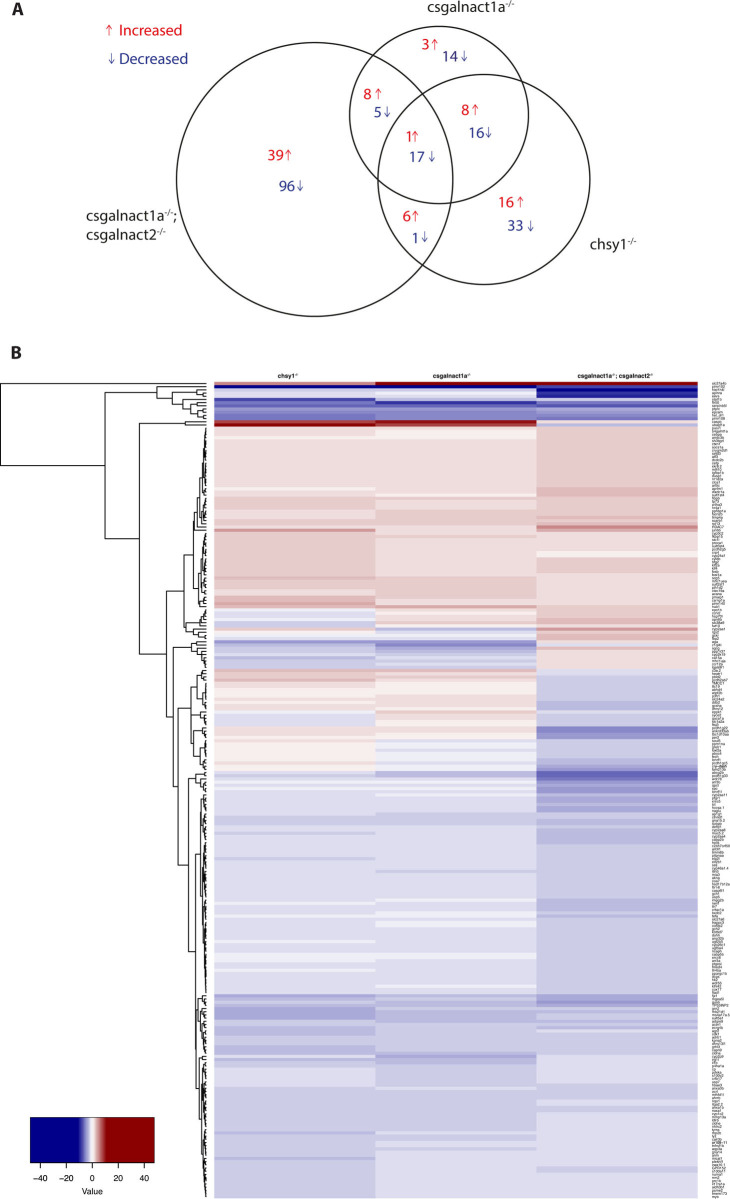
Fig 8
The area proportional venn diagram (A) shows differentially expressed genes in csgalnact1a-/-*, csgalnact1a-/-;csgalnact2-/- and chsy1-/- larvae compared to control larvae. The heat map (B) shows all genes with a two-fold increase (red) or decrease (blue) in the csgalnact1a-/-, csgalnact1a-/-;csgalnact2-/- or chsy1-/- larvae. * 50% of the csgalnact1a-/- individuals lack one functional allele of chsy1.
Acknowledgments
This image is the copyrighted work of the attributed author or publisher, and
ZFIN has permission only to display this image to its users.
Additional permissions should be obtained from the applicable author or publisher of the image.
Full text @ PLoS Genet.