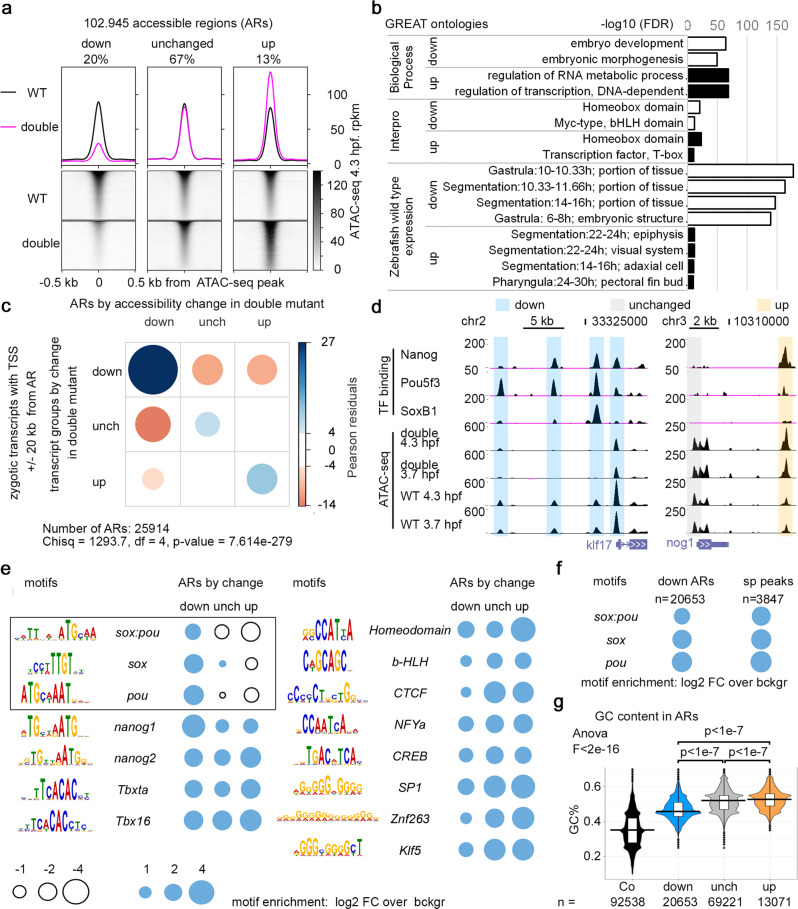
Fig. 5
a Three groups of accessible regions (ARs), where chromatin accessibility was reduced (“down”), unchanged, or increased (“up”) in MZsox19bspg double mutants relatively to the wild type. Regions were sorted by descending ATAC-seq peak score. b GREAT91 enrichment in Gene Ontology terms for “down” and “up” regions shown in a. Top two categories are shown in “Biological Process” and “Interpro”, four top categories in “Zebrafish wild-type expression”. c “down”, “unchanged” and “up” ARs are enriched around Transcription Start Sites (TSS) of zygotic genes, down, unchanged, and upregulated in MZsox19bspg double mutant, respectively. Chi-square test, p-value is two-tailed. d Pou5f3, SoxB1, and Nanog binding on the cis-regulatory regions of klf17 and nog1 genes, down- or upregulated in MZsox19bspg respectively. UCSC genomic browser view, TF binding and ATAC-seq signal—normalized reads. Note that all three TFs bind to the “down” cis-regulatory regions of klf17, but only Nanog to the “up” cis-regulatory region of nog1. e Enrichment for TF-binding motifs on “down”, “unchanged” and “up” ARs, relative to genomic background. Cognate motifs for Pou5f3 and Sox19b are enriched in “down” and underrepresented in “up” group (black frame). f Enrichment for sox:pou, sox and pou motifs on all “down” regions (ARs down) is close to that on the regions directly bound by Pou5f3 and SoxB1 (sp peaks). g GC nucleotide content of “down” ARs is higher than control genomic regions but lower than in unchanged and “up” ARs. To obtain control regions, genomic coordinates of ARs were shifted 1 kb downstream. Numbers of ARs (n) are indicated below the graphs. The lower border, middle line, and upper border of the white box plots correspond to 0.25, 0.5 (median), and 0.75 quantile, respectively. 1-way ANOVA, p-values in Tukey–Kramer test. Source data for a, b, and d–g are provided as a Dataset S3. Source data for e, f are provided as Dataset S4. Source data for c are provided as Dataset S5.

