
|
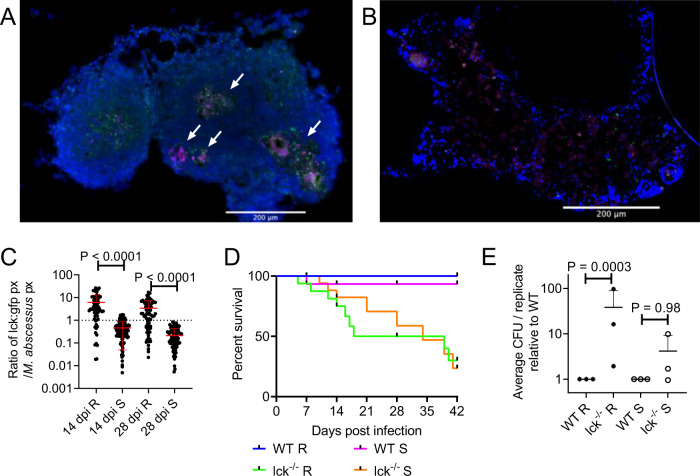
Fig. 5
A Examples of T cell recruitment to granulomas in 14 dpi TgBAC(lck:EGFP)vcc4 adult zebrafish infected with R M. abscessus-tdTomato. B Example of lack of T cell recruitment to S M. abscessus- tdTomato in a large cellular lesion from a 14 dpi TgBAC(lck:EGFP)vcc4 adult zebrafish. Scale bars indicate 200 ?m. Arrows indicate necrotic granulomas, M. abscessus-tdTomato is coloured magenta, lck:gfp positive T cells are marked in green. Images from A and B are representative of the dataset analysed in C. C Quantification of T cell GFP pixels as a function of M. abscessus-tdTomato fluorescence in TgBAC(lck:EGFP)vcc4 adult zebrafish. Each point represents a single lesion. Total n per group (lesions/animals): 14 dpi R = 74/2, S = 137/3; 28 dpi R = 91/3, S = 117/2. D Survival analysis of WT and lck?/? sa410 adult zebrafish infected with R or S M. abscessus. Total n = 12 WT/Mabs R; 16 lck?/?/Mabs R; 15 WT/Mabs S; 22 lck?/?/Mabs S. E Normalised CFUs recovered from 14 dpi WT and lck?/? sa410 adult zebrafish infected with M. abscessus. Each point represents the average of a single experiment with at least 2 animals per group. Total n per group: R WT = 12 lck?/? = 15; S WT = 11 lck?/? = 12. Statistical testing by two-sided ANOVA. Data are presented as mean values � SD. Source data are provided as a Source Data file.