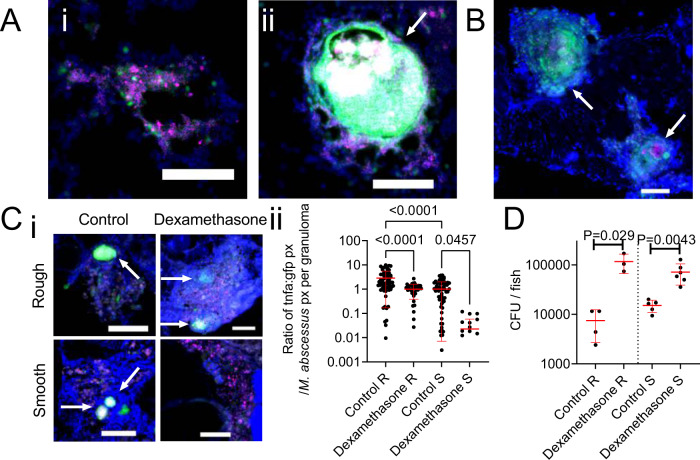
Fig. 3
A Examples of R variant M. abscessus-tdTomato lesions in DAPI-stained cryosections from a 14 dpi TgBAC(tnfa:GFP)pd1028 adult zebrafish. i. Cellular lesion, ii. Necrotic granuloma. Arrow indicates necrotic granuloma, M. abscessus-tdTomato is coloured magenta, tnfa promoter induction is marked in green. Scale bars indicate 100 μm. Images are representative of two biological replicates of 3 animals per replicate. B Examples of S variant M. abscessus-tdTomato lesions in DAPI-stained cryosections from a 28 dpi TgBAC(tnfa:GFP)pd1028 adult zebrafish. Arrows indicate necrotic granulomas, M. abscessus-tdTomato is coloured magenta, tnfa promoter induction is marked in green. Scale bar indicates 100 μm. Images are representative of two biological replicates of 3 animals per replicate. C i. Examples of tnfa promoter activity in 14 dpi TgBAC(tnfa:GFP)pd1028 adult zebrafish infected with M. abscessus-tdTomato and treated with dexamethasone as indicated. Arrows indicate necrotic granulomas, M. abscessus-tdTomato is coloured magenta, tnfa promoter induction is marked in green. Scale bars indicate 100 μm. Control images are representative of 3 animals per M. abscessus variant, dexamethasone images are representative of 2 animals per M. abscessus variant. ii. Quantification of GFP pixels as a function of M. abscessus-tdTomato fluorescence in TgBAC(tnfa:GFP)pd1028 adult zebrafish. Data are a single experimental replicate, each point represents a single granuloma, total animals per group: Control R = 3, Dexamethasone R = 2, Control S = 3, Dexamethasone S = 3. Statistical testing by two-sided ANOVA. D Enumeration of CFUs from adult zebrafish infected with either the R or the S variant of M. abscessus and treated with dexamethasone. Each point represents a single animal and data are representative of 2 biological replicates. Total number of animals: Control R = 4, Dexamethasone R = 3, Control S = 5, Dexamethasone S = 6. Statistical testing by two-sided Student’s t test within each of the independent R and S experiments. Data are presented as mean values ± SD. Source data are provided as a Source Data file.

